Can data help us anticipate crises?
August 2, 2023

Numerical data can convey otherwise complex information that usually requires pages of text to summarize.
As crises continue to erupt worldwide, the ability to address their adverse effects remains elusive. While the jury is still out on best practices for anticipating and responding to crises, the growing salience of what has been dubbed as ‘evidence-based policymaking’ has led to an increasing demand for data-driven analyses (DDAs). This is arguably because statistics are usually deemed apt at capturing, and processing, the high-frequency nature of crises.
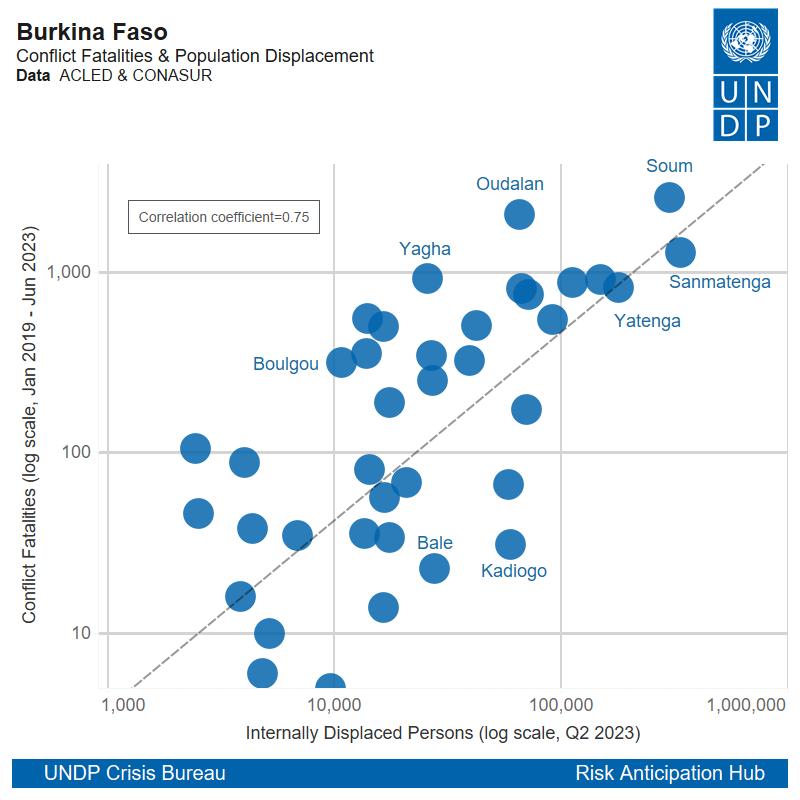
DDAs can provide a digestible way of measuring the temporal evolution and spatial distribution of crisis drivers like social unrest, macroeconomic imbalances, armed violence, food insecurity and population displacement. Through graphical representations, numerical data can convey otherwise complex information that usually requires pages of text to summarize. A visual can sometimes be worth a thousand words.
But while the quantitative approach has its notable advantages, data is often taken at face value, usually creating the illusion that statistics are unquestionably reliable. Because of the hazardous and even politicized method of collecting and disseminating information across crisis-affected locations, data must always be consumed with caution. Indeed, data is not impervious to errors, bias, misrepresentation or manipulation.
When dealing with issues that require contextual knowledge, data can only tell us so much. For this reason DDAs should be envisaged as complementary tools to qualitative insights. This is particularly true in crises, where widespread disruption can cause much confusion due to the multiplicity of events taking place simultaneously, some of which cannot necessarily be quantified.
Impact quantification
Data can be another word for stored information. It can be organized and categorized in ways that make it easier to analyze and visualize, especially large quantities of it. When coded in numbers and geolocated with coordinates, data has the power to provide a better sense of the frequency, magnitude and spatial distribution of measurable phenomena.

In turn, visualizing data can be a powerful communication tool. It can provide a general audience with digestible snapshots of how crisis-related events are intertwined, allowing decision-makers to track developments and respond accordingly.
When analyzing different datasets, careful consideration must however be paid to the caveats that data providers tend to identify, notably regarding the process of collecting and coding quantifiable information on crisis events. This is especially important when the sourcing of the information is incomplete, contested or even manipulated.

Data caveats
The ability to analyze data isn't seemingly as widespread as the ability to gather and disseminate qualitative information. Written reports are relatively more abundant than DDAs, even if, encouragingly, a growing number of written analyses are complemented by quantitative ones. This might be because more people are able and willing to inform on crisis situations using words or speech. It is also a reality that data on crisis-affected areas is harder to get.
It is important to know the limits of DDAs. On the one hand, there is still a relative shortage of data analysts, at least in UN agencies. This oftentimes makes it difficult to generate rapid DDAs that can shed some light on the evolving gravity of different crises in quasi real-time, especially when lives are at stake.
In turn, poor data limits the potential to develop more ‘sophisticated’ forms of DDAs, notably the ones that are growing in popularity and that aim to make use of Artificial Intelligence. But so long as crisis data remains largely small in sample size, DDAs in this realm will remain limited as large samples are required for statistical validity.
A hybrid approach
UNDP’s Crisis Bureau is testing ways to use advanced DDAs (ADDAs), as outlined in its new crisis offer. While its Risk Anticipation Hub (RAH) has generated ADDAs using Twitter data on hate speech in Sri Lanka and pre-electoral sentiment in Tunisia and Nigeria, the statistical outputs remain tenuous due to the amount of ‘noise’ inherent on social media platforms. Although a starting point, this is a reminder of the reality that ADDAs cannot uphold to their name so long as the quality of crisis-related data remains too poor to analyze from a statistical standpoint.
While UN agencies working in crisis-affected areas are becoming increasingly interested in the potential to anticipate crises, it is important to remember that data can only capture what can be measured. This exemplifies why it is so hard to ‘predict’ things like coups using just data. In other words, because the behaviour of political actors cannot be properly captured as quantitative information, any data-driven attempts to predict politically-driven events might be akin to shooting in the dark.
When looking at the recent coup d’etat in Niger, it is difficult to envisage how purely data-driven models could have played a role in anticipating the unfolding of events in Niamey. If anything, the case of Niger highlights how important qualitative insights remain, especially those that shed light on variables that are seldom, if at all, captured in datasets.
As such, qualitative analyses provided by UNDP country offices remain essential for providing the missing pieces. It calls on the need to ensure that crisis analytics should always strive to strike a hybrid balance between quantitative and qualitative inputs. Without it, the only risk we might run into is that of early warning becoming late notice.

 Locations