
 Locations
How might we use data more effectively and meaningfully for social good, such as for confronting the pandemic and building resilience for future crisis?
We posed this challenge last week, through our previous blog post, while announcing the establishment of UNDP Philippines’ Pintig Lab. Envisaged as a multi-disciplinary network whose purpose is to explore the use of nontraditional data sources and methodologies, Pintig Lab was launched in a bid to help inform the government's response and recovery strategy against COVID-19. We asserted that the pandemic challenges the breadth of our understanding of data—of what is available out there, who is producing it, and what is possible within ethical bounds—and how it can be used to augment our current arsenal of official statistics and administrative records.
Last week, we invited you to join us in exploring how data can help improve our understanding of the pandemic and our response. For this post, we delve into the socioeconomic impacts of COVID19. How can non-traditional tools and techniques help reduce our collective blind spots?
Precarity in the pandemic: impacts on small entrepreneurs and poor households.
When the metro-wide lockdown was imposed early in the pandemic, many feared that the health measure would come at the expense of the economy. Businesses, especially those that had minimal capitalization, would suffer losses due to the reduced mobility of their customers. That is if they were even able to open in the first place. Workers, especially those which were contractual or casual, would lose their jobs or forced to take a time off. Simulations which point to the increase in the ranks of the poor ranged from 1 million (by World Bank) to 6 million (by a UN University study).
But how would one exactly balance this “tradeoff” between pandemic control and economic vigor when good data is far from reach or when enumerators cannot be sent out to the field? Thus, UNDP Philippines, with its partners, tried out a new tactic: the use of widely available social media tools to take a quick pulse of the economy particularly its most vulnerable participants.
In collaboration with the Department of Trade and Industry (DTI) and the National Economic and Development Authority (NEDA), UNDP Philippines undertook a rapid response survey to assess how MSMEs’ value chains and business operations were affected by the lockdown. Data was collected in two ways: an online survey, including deployment through a Facebook Messenger chatbot; and social listening using artificial intelligence to help put nuance to the survey findings. Data collection was to be undertaken in three waves to check for progress over time.
Results from the first wave confirmed our worst fears, with 77 percent of MSMEs surveyed reporting the reduction in their income as their top challenge during the pandemic. Around the same proportion said they had to close their businesses; while about half experienced reduced demand and transportation issues that cut them off from value chains.
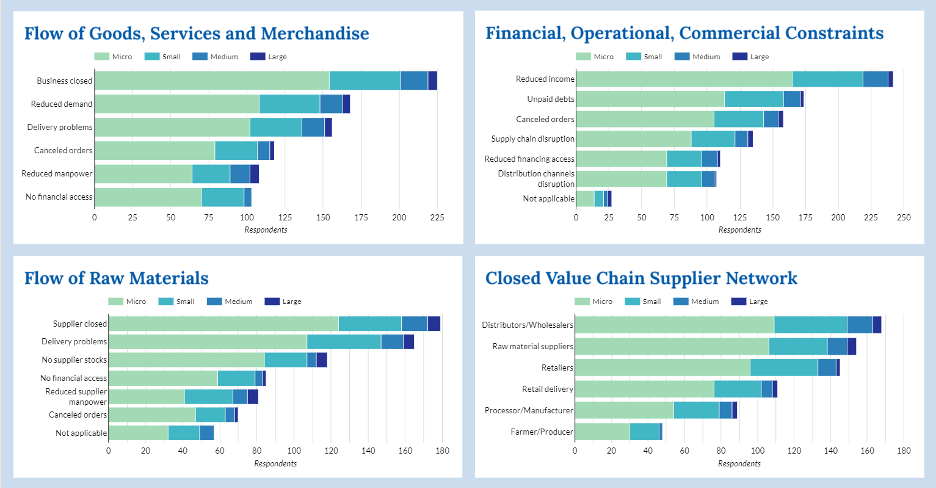
MSME Value Chain Rapid Response Survey
The results show that the pandemic’s effects were not only concentrated in the urban centers, as rural enterprises were cut off from their markets in the metro. The social listening exercise, for example, found incidences of farmers seeking help as they could not sell their harvest. Unfortunately, 80 percent of MSMEs surveyed—a larger proportion among rural enterprises—did not have access to any form of financial assistance from the government.
As store fronts were shuttered and buses were parked at the depos, many people were left without a source of income. But in what ways and who were most affected?
With the Zero Extreme Poverty Philippines 2030 (ZEP 2030)—a coalition of 140 civil society organizations—UNDP Philippines implemented a similar chatbot-based survey on the plight of vulnerable households. Wave 1 of the ZEP-UNDP COVID Pulse PH surveyed more than 3,000 low-income families in Metro Manila and Metro Cebu.
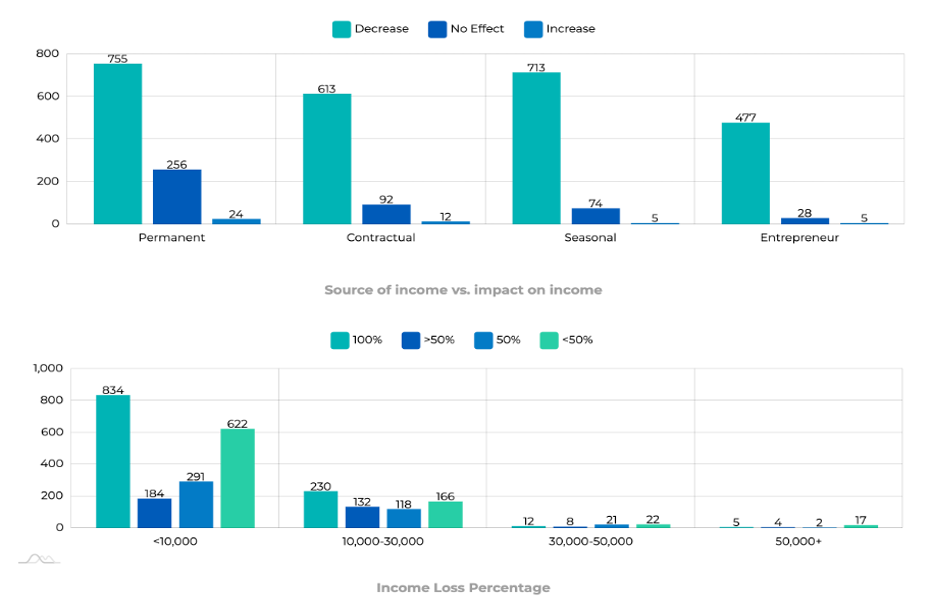
Snapshot of Dashboard of the ZEP-UNDP COVID Pulse PH
We found that 83 percent of the surveyed households experienced a decline in their income. What’s glaring is that 34 percent totally lost their source of income during the lockdown; and a larger proportion of 40 percent of temporary or informal sector workers lost their livelihood. In other words, the pandemic’s socioeconomic effects were skewed against those who were already in precarious positions.
In the face of certain suffering, the government and civil society came to the aid of those in need. As our survey shows, 94 percent of respondents received either cash or in-kind support, bulk of which from the government.
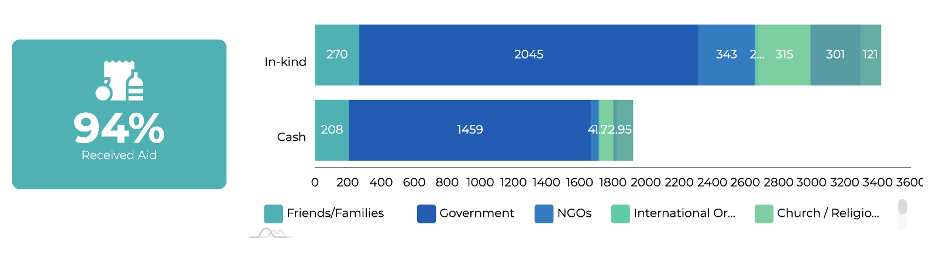
COVID pulse survey results
Socioeconomic support: can we spend more strategically?
The government is striving to curb the crisis with a focus on four pillars: support for vulnerable groups and individuals, medical resources to fight COVID-19, fiscal and monetary actions to ensure sufficient finance for emergency initiatives, and economic recovery.
Is the government allocating enough resources and utilizing these effectively to improve the plight of the poor? What can citizens do to help? A group of individuals initiated the COVID-19 citizen budget tracker, to try to answer these questions. By collecting information from the President’s report and official data to follow public finance flows for COVID-19 response, they hope to improve public awareness and vigilance on government’s actions.
The visual below shows that the Department of Social Welfare and Development (DSWD)’s focus on social protection and support for the vulnerable is receiving the highest amount of budget, achieving almost full deployment regarding the expenditure and reaching out to the largest number of beneficiaries under those programs.
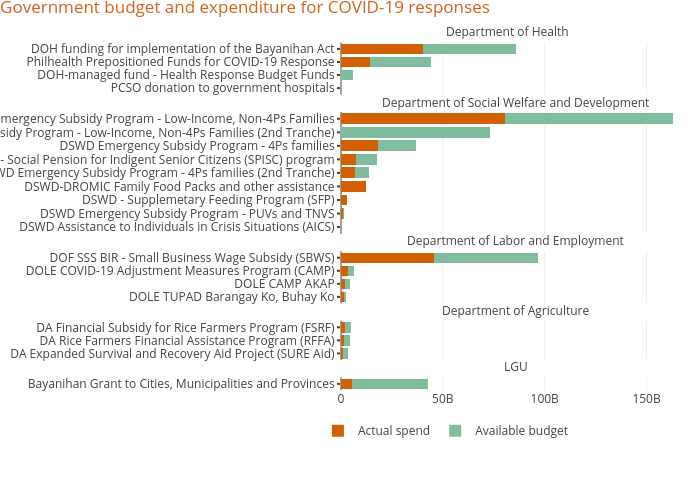
Data from citizen budget tracker from COVID-19 (as of June 29)
This is useful to give a quick overview of how the budgets are distributed within the government system, and then out to the people. Diving deeper into this, we can explore how they are spent at the sub-national level using data from the cost of assistance in the DSWD DROMIC reports. Using the funding source from DSWD as an example, the largest financial assistance is provided to NCR, Region VII, and Calabarzon. To view the spending of the family assistance program and ‘Cost of Assistance’ at the municipality level on the map, you can check here.
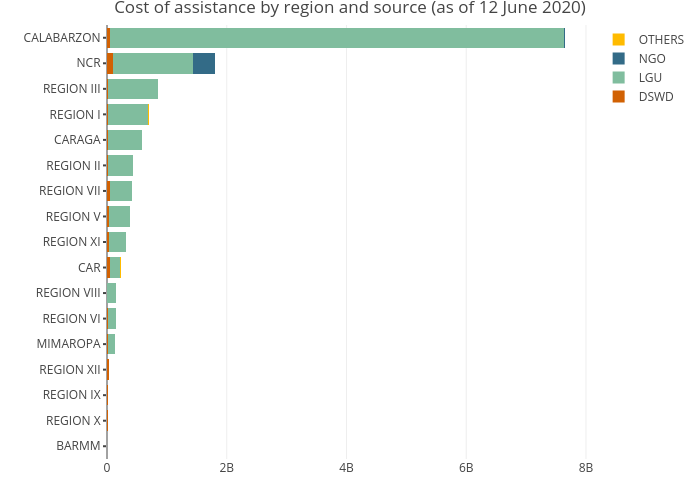
Caption: Data from DSWD-DROMIC Situation Reports (as of June 12)
Based on what we see from the diverse coverage of the COVID-19 response programs that target different dimensions in society, government agencies are intentionally supporting the vulnerable sectors from the pandemic’s impacts. This also resonates with the early finding we get from the socio-economic impact assessment on the households and MSMEs.
The provision of assistance to those who are most in need should be based on the assumption that vulnerable groups were seen and heard. The analysis of the quantitative data is pointing out the patterns as to where the problems are.
Surfacing their real needs, however, would require us to keep our feet on the ground, understand the personal stories behind the data, and excavate further through ethnographic research. Thus, Pintig Lab is also trying to ‘connect the dots’ of quantitative data and qualitative data to enhance the richness of analysis and insights. We are keen to know:
Where are the vulnerable individuals and communities? How can we identify the marginalized groups that do not have data footprints yet?
Are COVID-19 programs benefiting those most in need? Are there any unmet demands? Can we layer the distribution of those programs upon the map of the vulnerable to see whether there are any gaps in assistance?
Will it be possible to collect non-traditional data outside of the official statistics system and qualitative data for the mapping of needs in food security and livelihood?
These are just some lines of inquiry intrigued by our recent analysis with the available data. There remains, however, a deep unknown which requires further exploration. What does the new normal look like for the most marginalized: farmers, fisherfolk, women, the urban poor, among others? We are keen to collaborate. If you have any thoughts on the questions or have any relevant data initiatives to share with us, we would love to hear from you.
####
The Pintig Lab launched by UNDP Philippines is a multi-stakeholder network of data scientists, epidemiologists, economists, and other field experts that synthesize data from the public and private sector into policy recommendations that can inform the government's response and recovery strategy against COVID-19.


