
 Locations

Roman Minin mural in Myrnograd, Ukraine. Photo: UNDP Ukraine / Alisa Bankivska
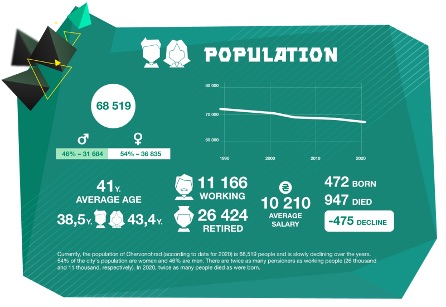
Chervonograd, in western Ukraine, stands as a union of diverse traditions. Palatial architecture sits among proletarian constructions, museums showcase historical and contemporary artefacts, and old religious monuments stand among modern storefronts. Since the 1950s, an expanding mining industry invited further enterprises, but the city's growth and population have been declining as the mines become unstable and unprofitable.
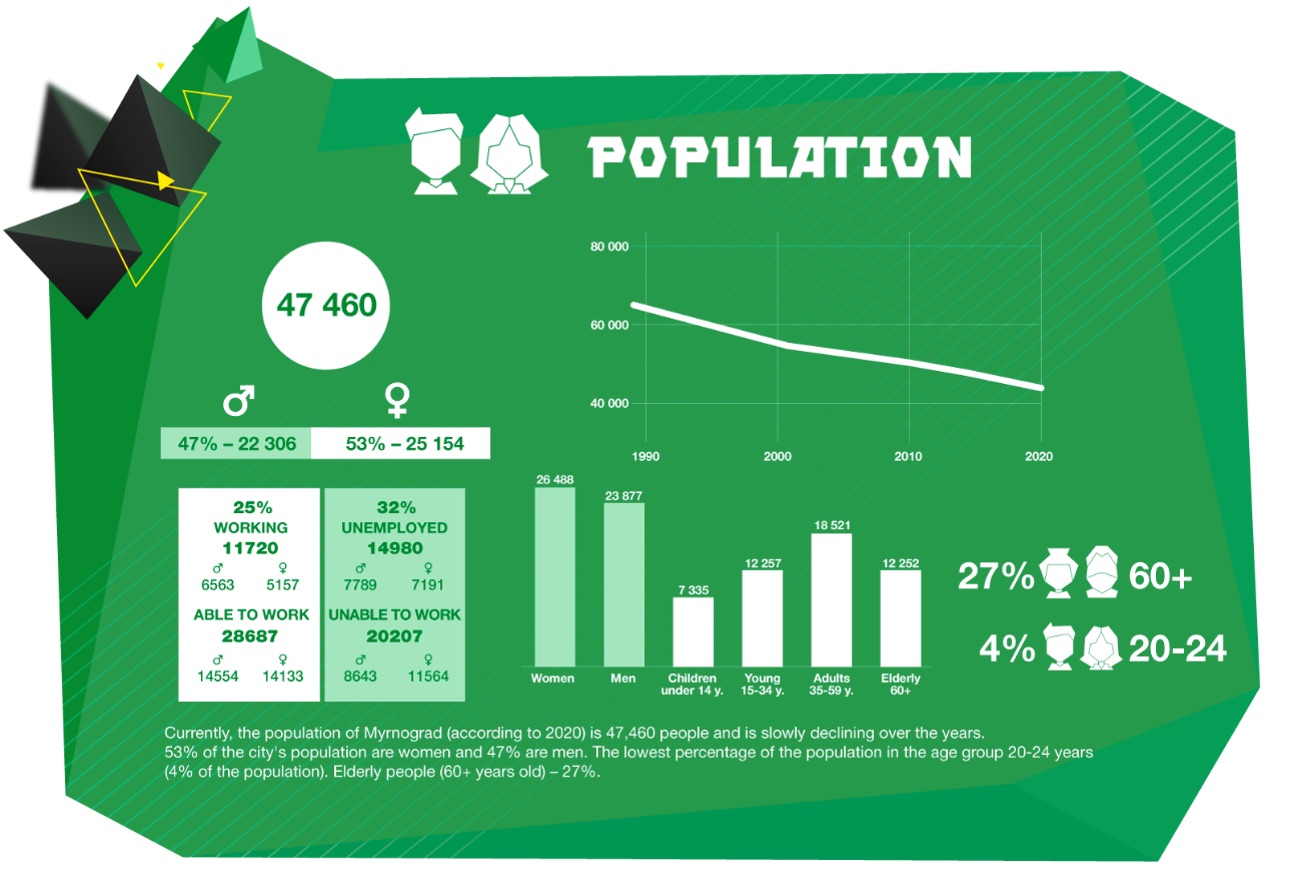
Myrnograd, in the east, is declining at a much more rapid pace than Chervonograd's – its current population is 47,460 citizens, compared to the latter’s 68,519. The very definition of a “mining town”, born from and deeply connected to mining for centuries, it now sees its prosperity dwindling. Proximity to the current armed conflict at the border only exacerbates an image of tragedy. However, trends toward gastronomic ventures, the arts and unique sports show its citizens are resolved to adapt to a changing future.
CHERVONOGRAD BACKGROUND INFO
MYRNOGRAD BACKGROUND INFO
Miners and their families now face a transformation of identity. The establishment of more diverse economies in their cities proves optimistic for a future independent of mines. The formation of multiple industries and investment in services weaves a safety net in case one business or service falters, but even more importantly, creates a place where people will choose to stay, live and flourish. We are supporting people of Chervonograd and Myrnograd in imagining what their futures looks like by conducting “Butterfly Effect” pilot studies. And the first step? System mapping.
Methodology explained
System mapping is the creation of a map of all existing and planned organisations or initiatives related to possible transformative change in a city at different levels: community, start-ups, small to large-scales industries, public services and regulations. Scientific results show that transformative change does not happen by introducing one big "unicorn" solution – we need transformation in a number of areas.
To begin mapping, we collect and input data from available official sources, e.g. the Centre for Innovations Development’s big data platform, which provides up-to-date economic and social indicators of the communities generated from more than 100 official state sources. These profiles provide data on business entities, individual entrepreneurs, major taxpayers, active assets, debts and so on. This allows us to “download” information about all private and public business entities functioning in the cities. We focused on the leading organisations by employee size and profit.

Kumu.io outputs data in a visual format, with each organization appearing as a dot on the map and size reflecting prominence.
Adding other entities significant to the daily lives of locals requires field research. By speaking with and listening to the people living through the transformation, we were able to collect data on other organisations and add new dots to kumu. With the database expanded to include small-scale operations, we could connect dots to illustrate relationships between organisations at all levels.
The initial maps for Myrnograd and Chervonograd show a number of connections, actors and clusters of activities that are important for the city. All this can be used for city planners, developers, citizens, and other actors as a basis for city transformation discussions.
On our side, we’re focusing on the #bigdata analysis and visualization of existing and potential transformation points.
Busting the myths
Combining our maps and the results from CID’s unified big data platform we were able to “bust” the main myths surrounding the coal mine phase-out in Ukraine.
Myth #1 – Coal mines are the only main employer in the cities
When looking at the number of employees in each organisation in each city, the biggest dots appearing on our kumu map were indeed the coal mines. Both cities have approximately the same number of mines, but Myrnograd relies more heavily on a single mine with a large number of employees, whereas Chervonograd spreads employees over several mines. But while the mines are the largest employers, they have large wage debts, which means they are not paying salaries.
The Chervonograd map reveals additional dots of comparable size to the mines. One of the city’s largest employers is Chervonogradska Central Hospital, followed closely by Kalyna Factory (garments);) Duna-Vest (socks and tights manufacturer) and the Chervonograd Steel Construction Plant.
Conversely, Myrnograd has only one alternative big employer: APK-Invest, an agricultural company producing grains and meat.
Myth #2 – Coal mines are the main economic drivers
When looking at profit in the cities, the dots representing the mines suddenly disappear from the system maps. Instead, the map of Chervonograd reveals the most profitable organisations are in trade, metal, textiles and agro. Myrnograd’s most profitable organisation is in agro.
Among the top three unprofitable entities in both cities? Mines.
Myth #3 – Coal mines are the main contributors to local budgets
When looking at revenues to the local budget, mines are not even the largest taxpayers. Some of the largest taxpayers are agriculture entities such as APK-Invest At the same time, some of the biggest debtors to the local budget are mines.
Myth #4 – There is nothing else to build on for city development except its coal-related heritage
“The whole city was created around coal. There is nothing else.”
“I am a miner. My grandfather and father were miners. This is the past and the future.”
When residents are asked about the possible alternative development of the city “after coal”, many have a hard time imagining something else.
A common form of alternative development in mono cities (after mine closures) is by attracting big investors, a.o. with the mining infrastructure incentives, tax reductions and other legal and financial conditions. But these investors often cannot guarantee big employment opportunities, and end up using the infrastructure as storage while benefiting from the special conditions. Big investors can also be another environmentally damaging industry.
So, sustainable and long-lasting transformation has to come from the community itself and be based on its inner strengths. In cities dependent on the coal industry for ages, it’s hard to find entrepreneurs, startups or businesses from people used to big scale employment opportunities. However, we can see areas where they can emerge.
If we look at all the dots in the Myrnograd system map, we see a significant number of small scale initiatives cluster around food and IT/robotics.
Several organizations joined the Food Cluster of Eastern Ukraine, developing gastro-tourism options and supporting chef classes in coal mining schools. As the agro sector leads employment and profits portfolio of the city, food enterprises seem to be a natural evolution of its strengths.
A number of initiatives around STEM education, such as coding and robotics, are emerging in the city, led by schools and NGOs, which could be transformed into digital business opportunities.
For Chervonograd, we have discovered less obvious areas of transformation involving the church and heritage tourism.
Religion has always been a bastion of Chervonograd’s community history. The church continues to provide for people today, with initiatives such as social bakeries, agricultural enterprises and learning youth summer camps. Why not transform them into early entrepreneurship trainings?
Heritage tourism also has big potential, with the Potocki Palace, churches and the city’s industrial history, which already attracted visitors and could continue to draw even more.
What is next?
System mapping can help us visualise how the people of these two cities, armed with their unique resources, can preserve their identity and dignity, nourish and grow their culture and solidarity, and ensure their sustainability throughout an era of decarbonisation.
These maps are still limited; we are aware that behind the available data there are a number of nuances like grey zones of informality. “The true transformation is in those nuances, and we call it K-factor [“K” for kultura/culture], says our mentor Gorka Espiau Idoiaga, Director at Agirre Lehendakaria Centre. K-factor reflects the system of beliefs and values that define a society: our origins, who we are, the way we think, what moves us and the reasons why. “And if society doesn’t believe the change is possible – probably it is impossible.”
Thus, the next step of our “Butterfly Effect” pilot studies is deep listening to people in order to discover cities’ K-factors.