
 Locations
What we knew then, what we know now: Looking back on COVID-19 in 5 Charts
December 31, 2020

Looking back on 2020 through the lens of #GraphForThought, it is evident how quickly both the development concerns in the region shifted as well as the data available to understand them. In LAC, we started off the year looking at longer-term challenges such as urban inequalities and demographic shifts as well as contemporary challenges such as the social unrest that was spreading throughout the region. However, come March our attention rapidly shifted to the pandemic and remained focused on the multiple crises brought on by Covid-19.
While at first the virus was slow to spread to LAC countries, the region experienced a tidal wave of infections—becoming the epicenter of the pandemic during the months of July and August. From August onwards, LAC has been leading the total number of deaths worldwide with over 486,000 cumulative deaths. While the world is ending 2020 with over 77 million cases and more than 1.7 million deaths, the LAC region accounts for 20% of total cases and 30% of total deaths in the world. A disproportionate representation considering that LAC countries are less than 9% of the world population. While the region looks to be on a downward trend, it is unclear if this progress will be sustained into the new year.
Countries in LAC took early and decisive action to “flatten the curve” by implementing containment policies such as lockdowns and quarantines, but the pandemic was still devasting in the region. In #GraphForThought, we explored related challenges such as existing health sector capacity, the socioeconomic privilege associated with being able to stay at home, the prolonged nature of lockdowns in the region, the role of existing noncommunicable diseases in fostering a ‘syndemic,’ the parallel challenge of an ‘infodemic,’ and as well as the underreported scale of the tragedy as measured by excess mortality. As businesses and schools shut their doors and countries closed their borders, the health crisis also became a social, economic, and governance crisis. In #GraphForThought, we explored related challenges such as inequalities in distance learning, the rise in searches for social protection benefits, the capacity to expand cash transfers through existing social registries, inequalities in access to remote working arrangements, changes in labor force participation and employment by gender, economic losses due to tourism declines in the Caribbean, increases in domestic violence during quarantine, and the resilience of remittance flows to the region. While some of the challenges brought on by COVID-19 were new, most of them emerged from or were exacerbated by the structural challenges that already existed in the region—many of which were behind the social unrest with which the year began.
This Year in Review revisits 5 COVID-19 related #GraphForThought posts, updating them with more recent data—reflecting on what we knew then, and what we know now.
1. Getting better at accounting for deaths: Revisiting data on COVID-19 deaths and excess mortality trends
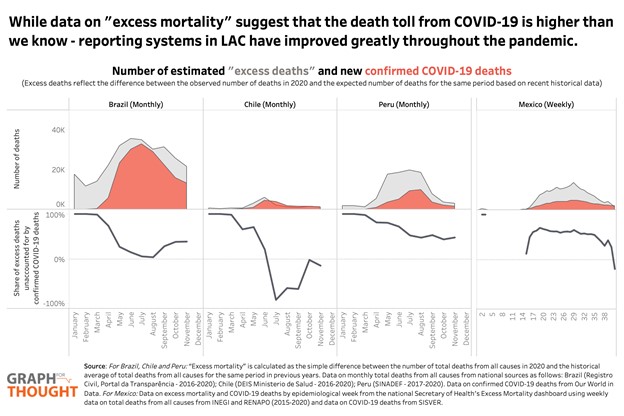
The July 7th #GraphForThought post “A greater tragedy than we know: Excess mortality rates suggest that COVID-19 death toll is vastly underestimated in LAC” compared confirmed COVID-19 deaths with excess mortality data from The Economist for four countries in the region (Brazil, Chile, Mexico, and Peru).
At the time, the data suggested that actual death toll from COVID-19 was much higher than was being captured in official statistics—as much as five times higher in some locations. However, countries were still in the process of scaling up COVID-19 testing and improving their methodologies to report on associated deaths. Since then, many countries in the region have refined their information systems and have developed working groups to report national and subnational statistics not only on confirmed COVID-19 deaths but also on excess mortality rates (see for example, government dashboards on excess mortality from Chile, Mexico, and Peru).
Using updated data on excess deaths and confirmed COVID-19 deaths (from national sources and Our World in Data as indicated in the source notes of the graph), we can see how reporting on COVID-19 deaths has changed throughout the pandemic. While the true death toll from COVID-19 is likely still much higher than we know, reporting systems in LAC appear to have improved greatly throughout the pandemic—as the graph shows smaller discrepancies between the number of excess deaths (light grey curve) and the number of confirmed COVID-19 deaths (red curve) as the year wore on. The dark grey line charts how the share of excess deaths unaccounted for by confirmed COVID-19 deaths changes over time in each country.
2. A decreasing effectiveness of stay-at-home orders: Revisiting data on COVID-19 lockdowns and mobility patterns
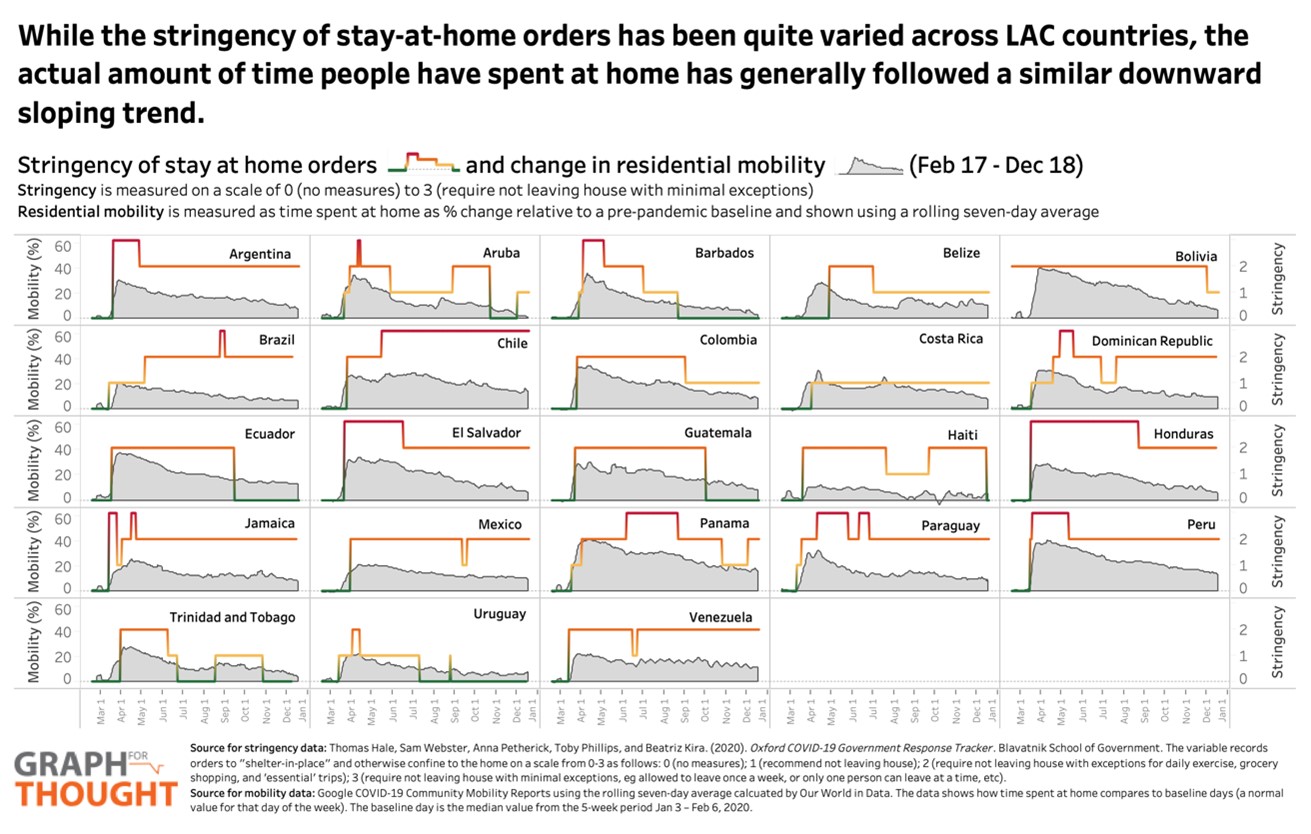
The September 23rd #GraphForThought post “Home Alone: Sustaining compliance with prolonged COVID-19 stay-at-home regulations in LAC” compared the stringency of “stay at home” orders in the region with actual changes in residential mobility using data from the Oxford COVID-19 Government Response Tracker (OxCGRT) and from Google’s COVID-19 Mobility Reports. At the time, the data suggested that the prolonged lockdowns in LAC countries were losing their efficacy—showing that while most countries saw high initial compliance with stringent stay-at-home orders, people began spending less time at home in recent months.
More recent data suggests that this patten has continued throughout the year’s end. As the updated graph shows, despite the fact that the stringency of stay-at-home orders has been quite varied across LAC countries (the colored line), the actual amount of time that people have spent at home has generally followed a similar downward sloping trend in all countries. It would seem then that while quarantine works up until a certain point, people eventually just begin moving anyway—indicating that long-term containment strategies must look beyond prolonging stringent stay-at-home orders indefinitely to also consider what “smart” reopening could look like—including clear protection protocols, social protection instruments to compensate people for lost income, universal connectivity and digitalization to promote the inclusion of students and workers, and effective governance to reach vulnerable populations.
3. A year of schooling lost: Revisiting data on COVID-19 related educational losses
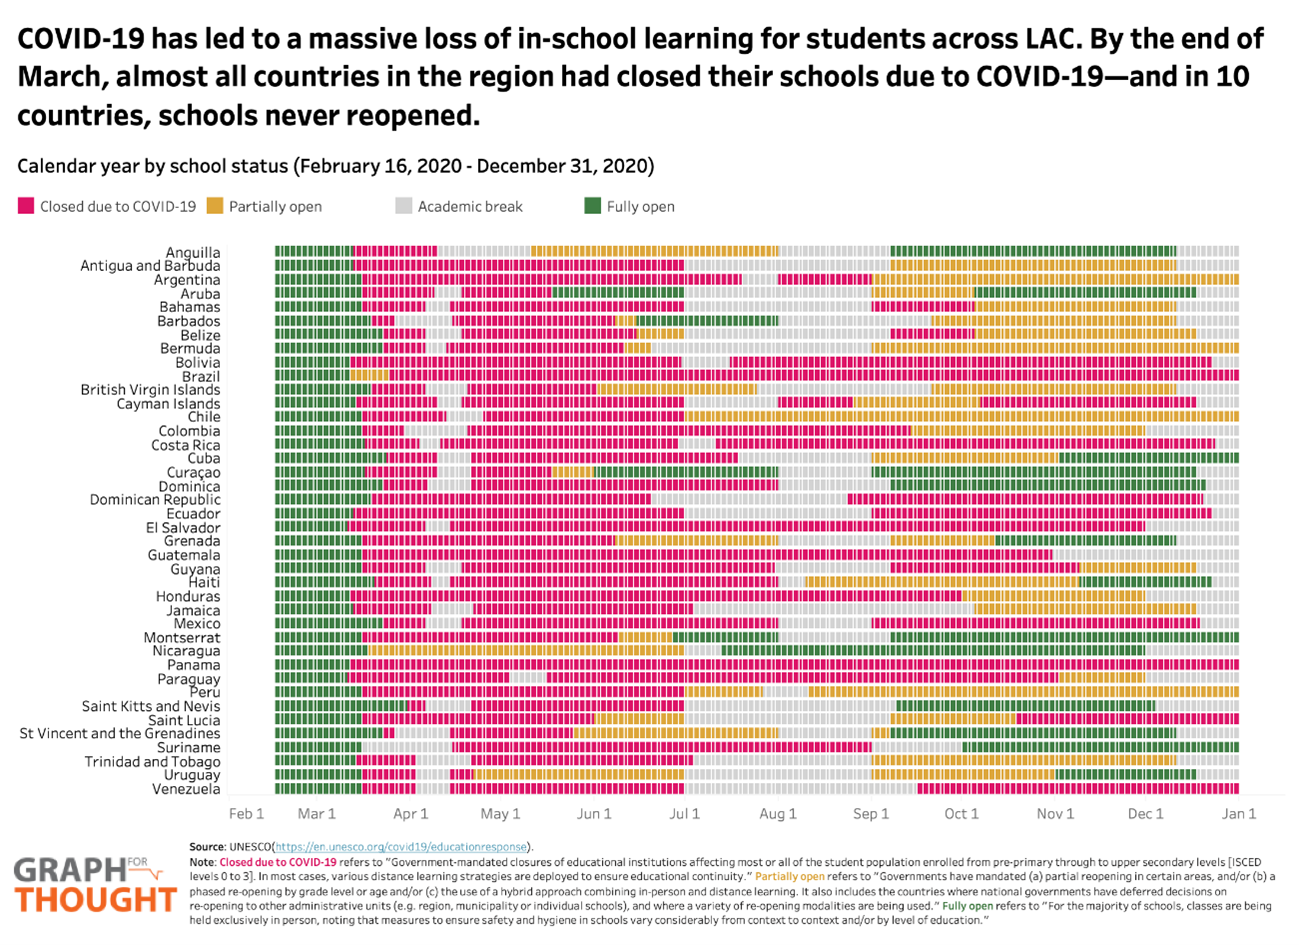
The April 27th #GraphForThought post “Hey teachers, (don’t) leave the kids alone! Connectivity and education disparities in times of COVID-19” looked at the potential for learning losses in the region due to school closures highlighting disparities in access to distance learning tools and parental education between richer and poorer students. The data showed that in LAC, children in the richest income group were systematically more likely to have access to the tools necessary for virtual learning. While the gaps are largest for access to internet and desktop computers, gaps also emerge in more basic elements such as access to a desk to study at. Similarly, the data showed that at least 50% of children’s mothers in the richest income bracket had a university education, while only 10-40% of children’s mothers in the poorest income bracket did. This has the potential to further perpetuate historical educational inequalities given that students’ learning outcomes likely become even more dependent on their parents’ abilities during school closures. At the time of the post, students had lost almost a month of in-person classroom lessons.
However, as the pandemic stayed with us, so too have school closures. Using updated data from UNESCO on school closures during COVID-19, we see that school closures in LAC have been prolonged in many countries. Looking across the calendar year we see that by the end of March, all countries in the region (except for Nicaragua) had closed due COVID-19—and in 10 countries, schools never reopened. As 2020 comes to a close, we see that in 12 countries in the region schools ended the year closed due to COVID-19, in 15 countries schools ended the year partially open, and in 13 countries schools ended the year fully open. There are also notable differences between Latin American countries and Caribbean countries in this regard—among those countries that have fully opened schools for at least part of the year, the majority of them are in the Caribbean. Not only are prolonged school closures likely to lead to declines in overall learning and increases in learning inequalities, but there is also a heightened risk of dropping out as students may be less likely to return after a longer period of time. Recent estimations from Lustig, Neidhöfer, and Tommasi (2020) project a drop in the likelihood that students complete secondary education in the region from an average of 61% to 46%.
4. A slight rebound of employment, but less so for women: Revisiting data on COVID-19 related employment losses
The August 4th #GraphForThought post “Sour Grapes: Discouraged workers and Labor Markets in the Context of the COVID-19 crisis” used data from national employment surveys to track changes in the number of people in the labor force and compare changes in employment by gender for four countries in the region (Chile, Mexico, Colombia, Peru). At the time, the results found that the number of people out of the labor force was surpassing the number of people in the labor force for the first time in ten years. Moreover, we saw a stark drop-in the employment rate, measured as the number of employed as a share of the working age population, as the indicator fell around 20 percentage points since the start of COVID-19.
More recent data suggests there has been a slow recovery in the evolution of employment rates, for both men and women. Overall, the indicator has increased 11 percentage points since the original post, meaning that no country has returned to the levels prior to the pandemic. However, some countries have shown more progress than others. In Chile, the female and male employment rate reached the lowest point in June (36% and 55%, respectively). Since then, both indicators have increased just 3 percentage points. In Colombia, the employment rate fell to the lowest point in May (33% for female and 55% for male). The latest data available show that the employment rate has increased by 6 and 9 percentage points, respectively. In Mexico, the lowest point was reached earlier in April, with 33% female and 58% male employment rate, and the recovery has been slightly better, rising 7 and 12 percentage points, respectively. In Peru, the female and male employment rate fell to the lowest point in May (23% and 32%, respectively). The latest data available show the largest recovery, as the employment rate increased in 20 and 29 percentage points, respectively. Despite the progress in all countries, the situation is still concerning for women as the female employment rates are recovering slower than male employment rates, meaning that women still are being hit hard by the crisis.
5. More spending, less poverty…but for how long?: Revisiting data on COVID-19 related social assistance expansion
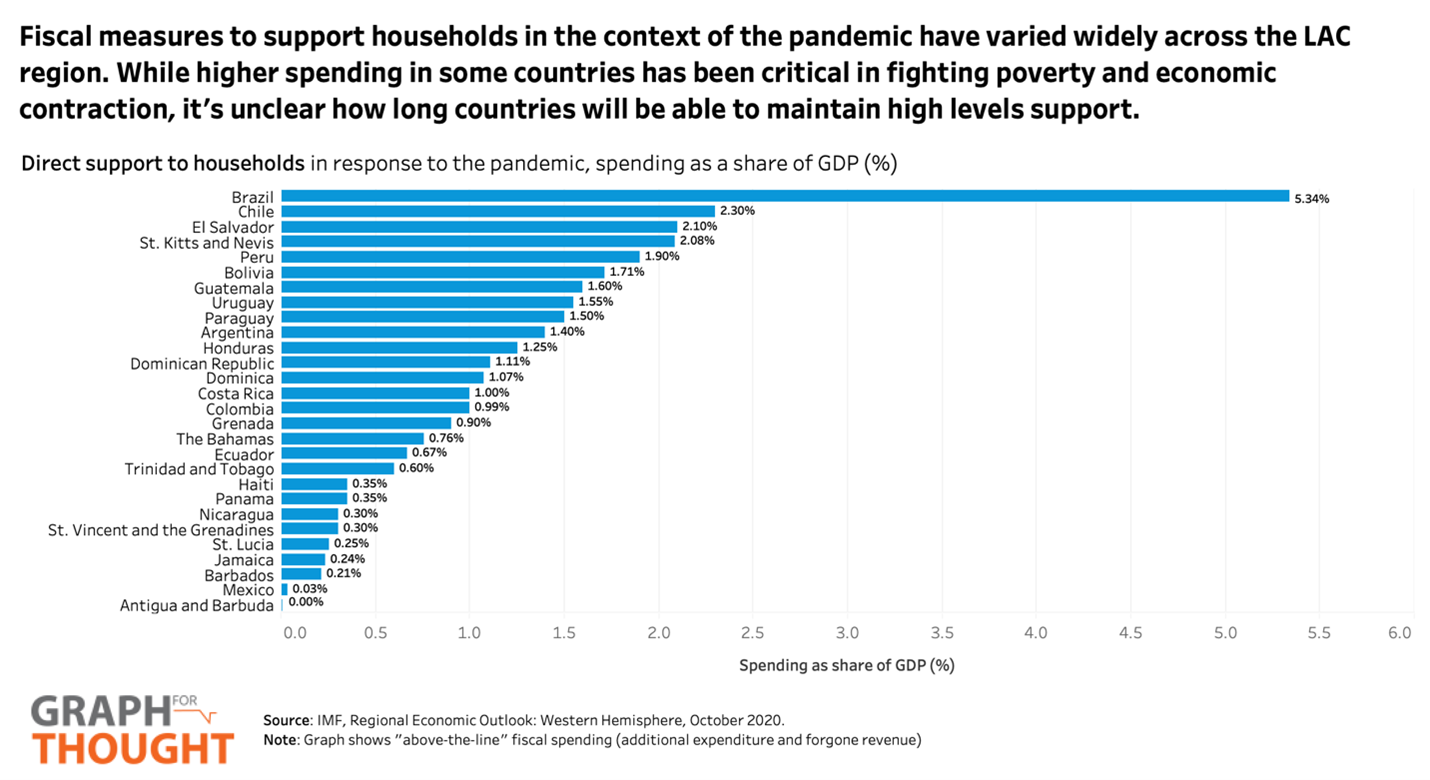
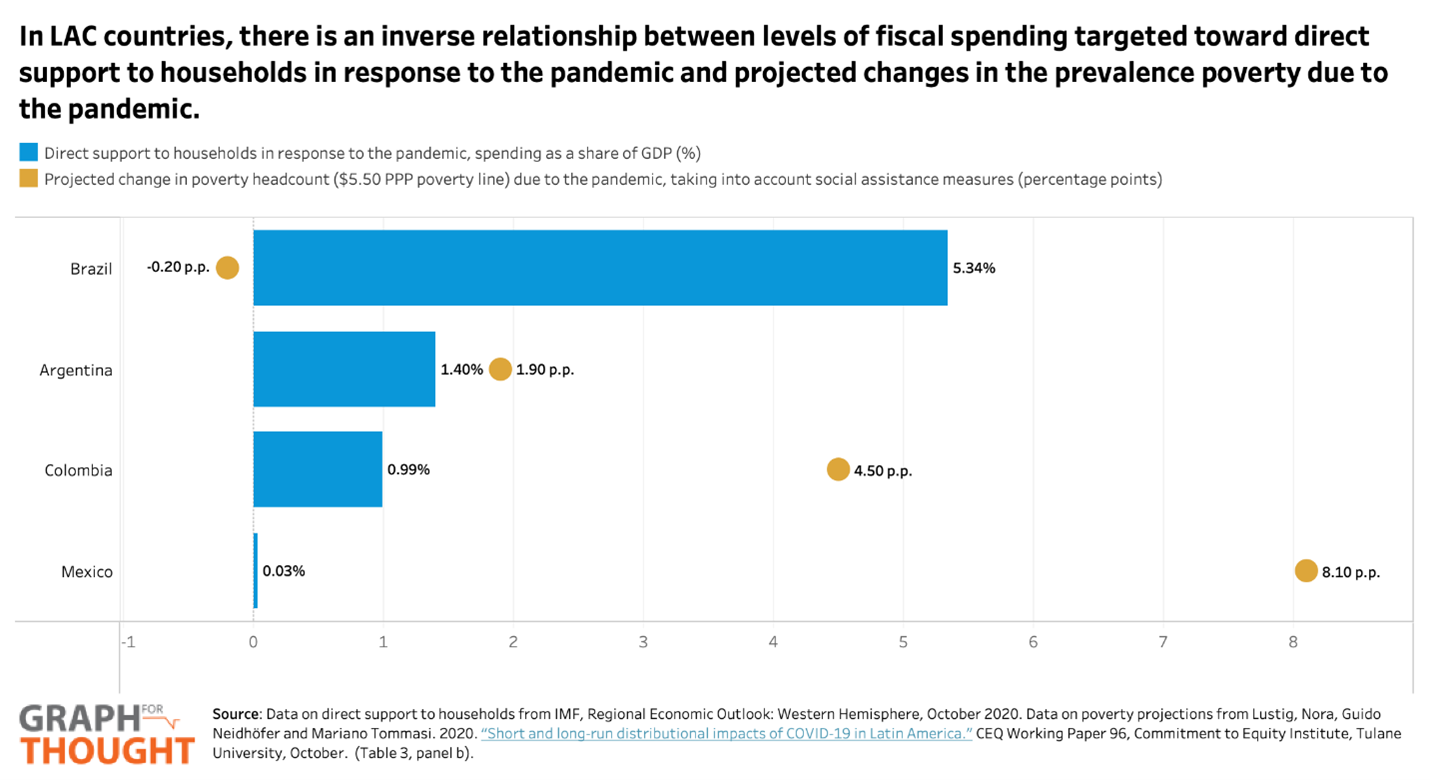
The September 3rd #GraphForThought post “Inclusion requires capacity: The role of social registries in expanding cash transfers in the wake of COVID-19” looked the coverage of social registries in the region as a way to gauge countries’ capacity to rapidly scale up social assistance programs to vulnerable populations during the crisis. At the time of the post, we saw a wide range of coverage for existing social registries and cash transfer programs—seeing that in some countries, social registries cover a far broader segment of the population than those currently receiving cash transfers (suggesting vast scope for rapid horizontal expansion of benefits), whereas in others, this scope is much more limited. While it is difficult to find cross-country data on how much these cash transfer programs have actually been expanded during the crisis (given the creation of new programs, expansion of old programs, and overlap between programs), spending data from the IMF’s regional economic outlook on fiscal measures providing direct support to households offers an alternative view of this question. Looking across countries, we see vast heterogeneity in spending (as a share of GDP)—ranging from over 5.3% in Brazil to less than 0.1% in Mexico and Antigua and Barbuda. Higher spending has been essential in combatting poverty and economic contraction in some countries. Indeed, we see an inverse relationship between fiscal spending as a share of GDP (blue bars) and projected increases in poverty (at $5.50 PPP poverty line) when social assistance measures are taken into account (yellow dots). For example, Brazil has spent 5.34% of GDP in direct support to households, and is expected to see a decrease in poverty of 0.20 percentage points; Argentina has spent 1.40% of GDP, and is expected to see an increase in poverty of 1.90 percentage points; Colombia has spent 0.99% of GDP and expected to see an increase in poverty of 4.50 percentage points; and Mexico has spent 0.03% of GDP and is expected to see an increase in poverty of 8.10 percentage points.
Looking forward
As we enter the new year, we must remember that we are still facing a formidable challenge. While infections are currently falling in the region and the promise of vaccine distribution is close on the horizon, COVID-19 is still very much with us—as are the multiple economic, social, and governance crises associated with it. While the path to recovery may be long and bumpy, it is also a chance to pave the road to a better future. As we rebuild, we must ensure that we do not only treat the damage from this current crisis but also fundamentally treat the “pre-existing conditions” that characterized our region prior to the pandemic, so that can create more productive, inclusive, and resilient societies for all.