Rethinking development in Latin America and the Caribbean
January 10, 2019

The 2030 Sustainable Development Agenda, adopted in 2015 by countries around the world, and their predecessor, the Millennium Declaration, have played a critical role in creating a common aspiration for the future—one that is more just, sustainable, and prosperous for all. While its 17 Sustainable Development Goals (SDGs) set our broader aspirational line of sight, this Agenda can only be successfully pursued in our region by taking into account the particular characteristics of Latin America and the Caribbean (LAC). Moreover, it is critical that we dig deeply into the context-specific challenges and opportunities facing the countries in our region, engaging with the cutting edge of development thinking and research. It is also critical that we do so in a way that is concrete and based on facts—not just in jargon or slogans.
In this spirit, I am launching a series called “Graph for Thought.” Each post, I will a share a data visualization illustrating how a different economic, social, or environmental issue is taking shape in the region, as an invitation to reflect, refine our questions, and think about development policy.
The first fact I would like to share is one that is relatively-well known—but is foundational to defining our new approach to development in the region: Latin America and the Caribbean is a middle-income region but has not yet become a middle-class society. National economies in the region have grown rapidly and steadily over the past few decades, but this growth has not necessarily been equitably shared across households. This follows the vulnerability approach to middle class, originally presented in Ferreira et al (2013) and Lopez-Calva and Ortiz-Juarez (2014)
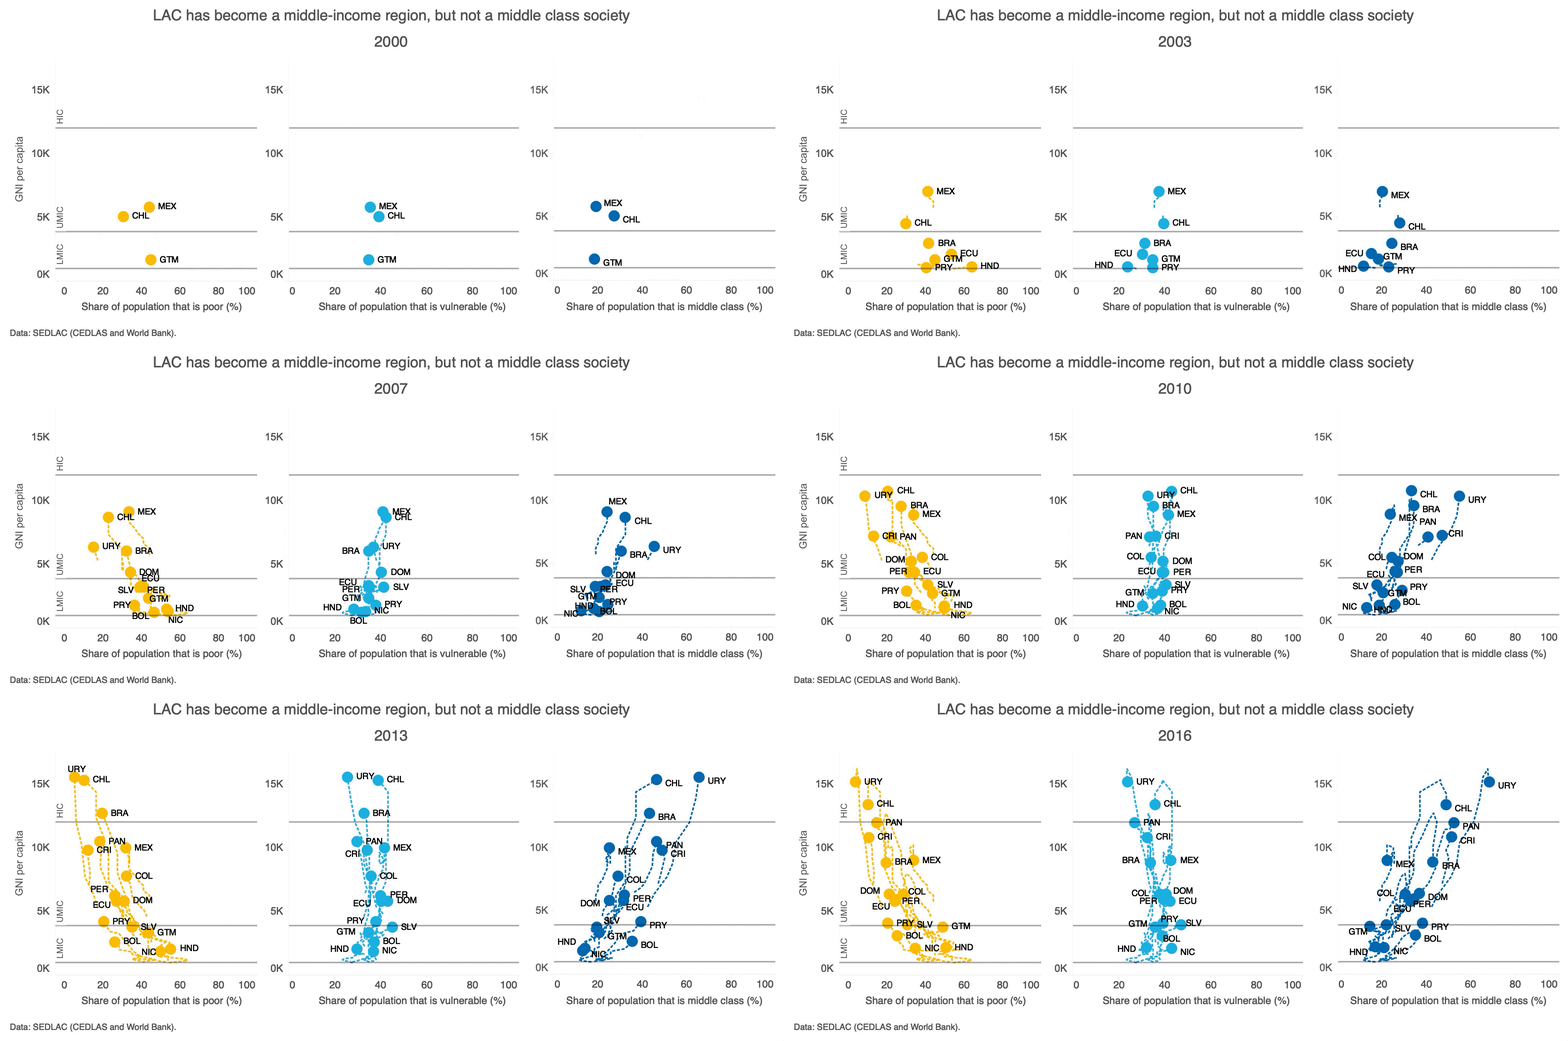
In the figure below, we can see how countries have steadily increased their Gross National Income (GNI) per capita. As the dots move upwards and cross the different GNI per capita thresholds (lower-middle income, upper-middle income, high-income), they are graduating to new income groups. By 2016, all countries in the region graduated to middle income or high-income status.
This evolution is the result of economic growth and changes in their distribution of income. As the dots move to the right or left, they show the changing share of the population defined as poor, living on less than $5.50 2011 purchasing-power parity (PPP) per day, vulnerable (between $5.50-$13.00 2011 PPP), and middle class (between $13.00-$70 2011 PPP). In the figure we can see that poverty has steadily been decreasing in all countries (all the orange dots moved left). However, despite this important achievement – we can also see that the economic security of households has not necessarily stabilized. Many households in the region remain vulnerable (the green dots have not moved very far to the left –and in many cases, have actually moved to the right, suggesting an increasing share of households who are vulnerable). These households have a relatively high probability of falling back into poverty if some sort of an adverse event or shock were to happen. While the middle-class has certainly expanded (the blue dots moved to the right), on average across the region, there are more people still ‘vulnerable’ (37.6%) than belonging to the ‘middle class’ (35.4%).
Countries in the region aspire, however, to become strong, middle-class societies. A consolidated middle class is important not only because it means that more people will be living a life free from poverty—but also because it is an important engine for fostering economic growth and because it can give rise to a more stable and cohesive social fabric. This leaves us with the bigger question—how do we get there? This question is the driving force behind our new regional narrative—which contends that the way to get there is a road with three lanes: productivity, inclusion and resilience. Importantly, these three lanes are interconnected and cannot advance without one another. Moreover, the process of paving these three lanes requires effective governance as a precondition. The upcoming posts in the ‘Graph for thought’ series will begin unpacking some of the ways that productivity, inclusion, resilience, and effective governance manifest in the region and what this means for the roadmap toward our aspirational line of sight.
Data: Poverty, Vulnerability, and Middle Class data from World Bank LAC Equity Lab tabulations of SEDLAC (CEDLAS and the World Bank). “Poor” corresponds to share of population living on less than $5.50 (2011 PPP), “Vulnerable” corresponds to the share of population living on between $5.50-$13.00 (2011 PPP), and “Middle Class” corresponds to the share of population living on between $13.00-$70.00 (2011 PPP). GNI per capita Atlas Method (Current US$) data from World Bank World Development Indicators.

 Locations