
 Locations

Photo by Christopher Burns on Unsplash
A summary of the attributes in the tracking tool and dashboard designed by the accelerator lab to improve care for women, girls, and adolescents at risk of violence in Mexico City, and the experimentation methodology used to test its effectiveness step by step.
This is our third blog post (here you can consult the first and here the second) on the collaboration between the UNDP Mexico Accelerator Lab (AccLab MX), UNAM's Civic Innovation Lab (CivicTech Lab), and Mexico City to improve services for the care and prevention of violence and the promotion of women's physical, economic and political autonomy in the context of the COVID-19 health emergency.
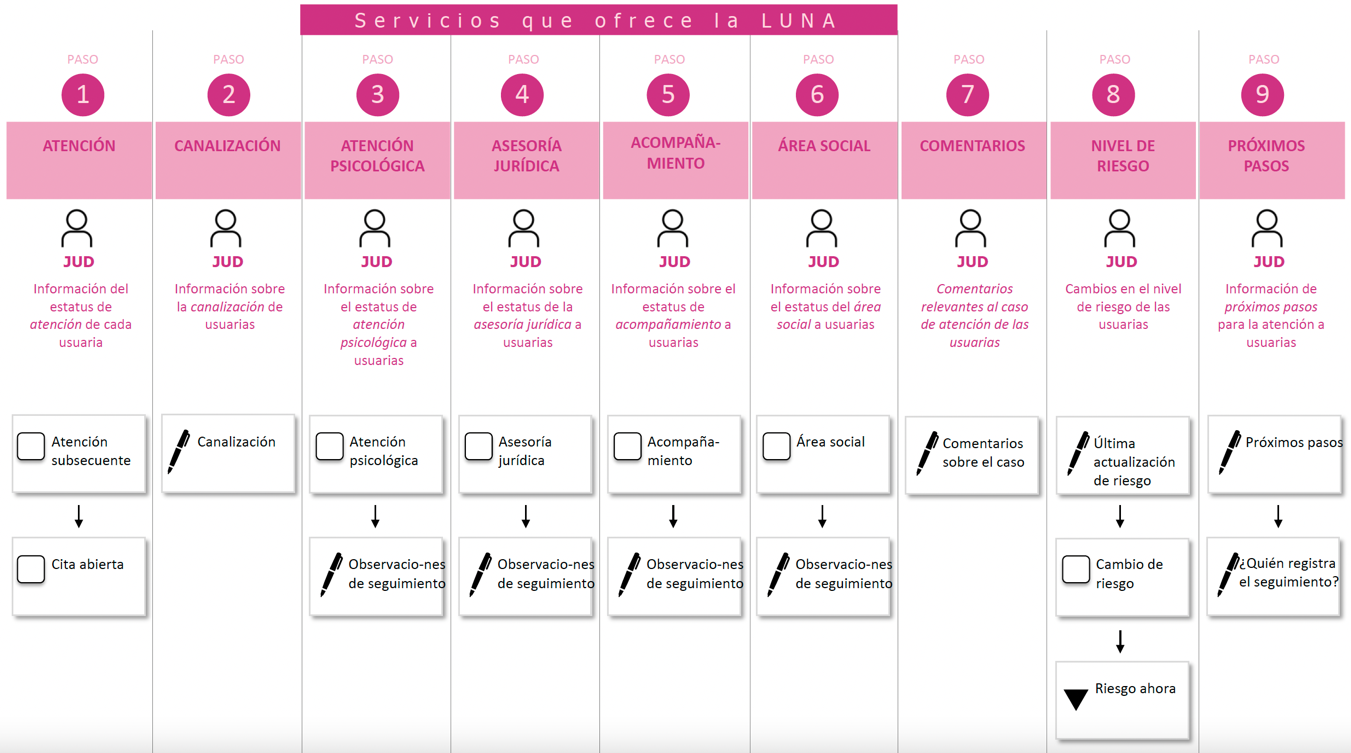
After the first phase of understanding, we decided to design a Tool for weekly follow-up for users and a Dashboard fed with real-time data. Both products were selected to help the LUNAS in Mexico City lighten the burden of administrative and follow-up tasks that they perform every week. With these tools, people could standardize the work processes among the different LUNAS, help collect and share information in a more agile way, and organize the information collected in an automated way, to improve the program's strategic decision making.
Tool for weekly tracking of LUNAS users
The LUNAS weekly user tracking tool is a spreadsheet designed with the Google Sheets platform that allows the person in charge of LUNAS (the Departmental Unit Head or JUD) to keep track of the number of users served by LUNAS, monitor the services they received, follow up on each of the cases and integrate a file in an automated way. To arrive at the final determination of the variables that would make up each user's record, a sample of previously used formats was reviewed. Subsequently, the variables were standardized and a six-week pilot was carried out with the participation of LUNAS in five different Mexico City municipalities.
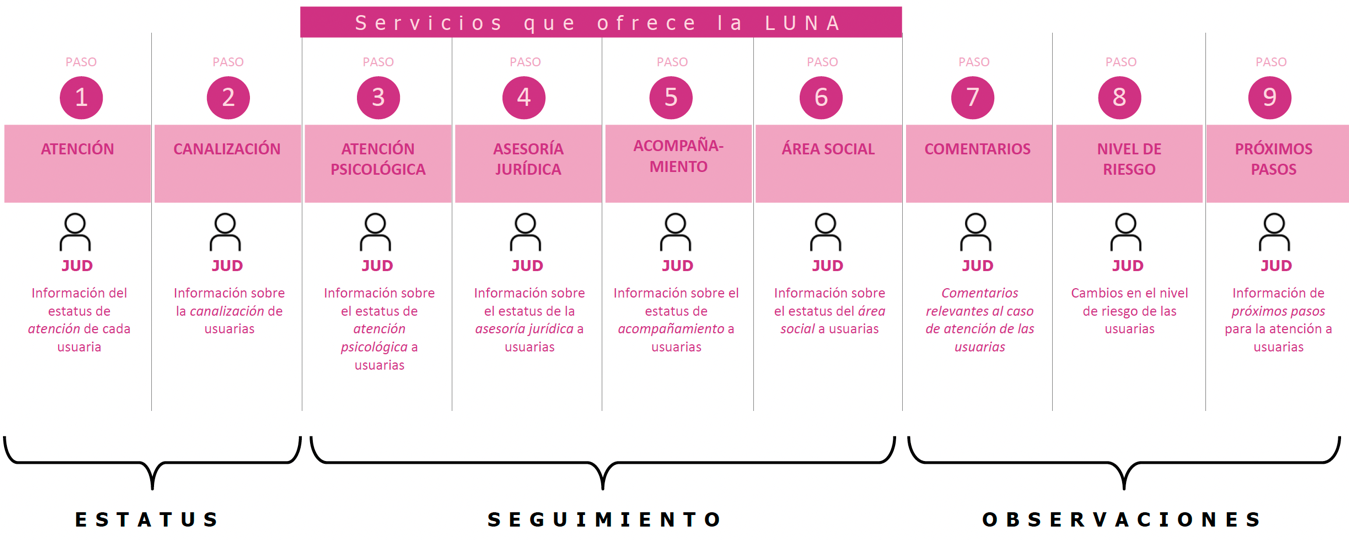
The information collected in the tool was summarized in four categories shown below. The first three categories contain information that is collected only once, ideally, at the time of initial contact with the user, but if this information is not available at that time, it can be integrated later or incorporated as the case evolves. The last category contains information that is updated weekly to integrate the user's history. This allows us to keep track of the services provided and to monitor changes in the user's risk level.
- Personal data of the user: Name(s), occupation, schooling, and other contextual information that allows us to know who she is, how old she is, if she has children, as well as to know if other people could be indirect victims. It also includes the date from which the relationship with a LUNA began.
- Data on the aggressor: Available contact information, his relationship with the victim, occupation, schooling, and factors related to the level of risk of violence. To measure the risk of violence, it is recorded whether the person suffers from alcoholism, substance abuse, or has access to firearms.
- Crime data: Summary of the most important information about the act of violence for which the user is seeking help. It also includes whether she has an open investigation record with the Public Prosecutor's Office, the Sole Registration Number in the Network of Information on Violence against Women (RIVCM), the type of violence, the protection plan, and linkage to other support programs.
- Tracking panel: Contains the status of the user's care, the follow-up of the services received to integrate the record of observations that allow the LUNA manager to keep track of each of the cases.
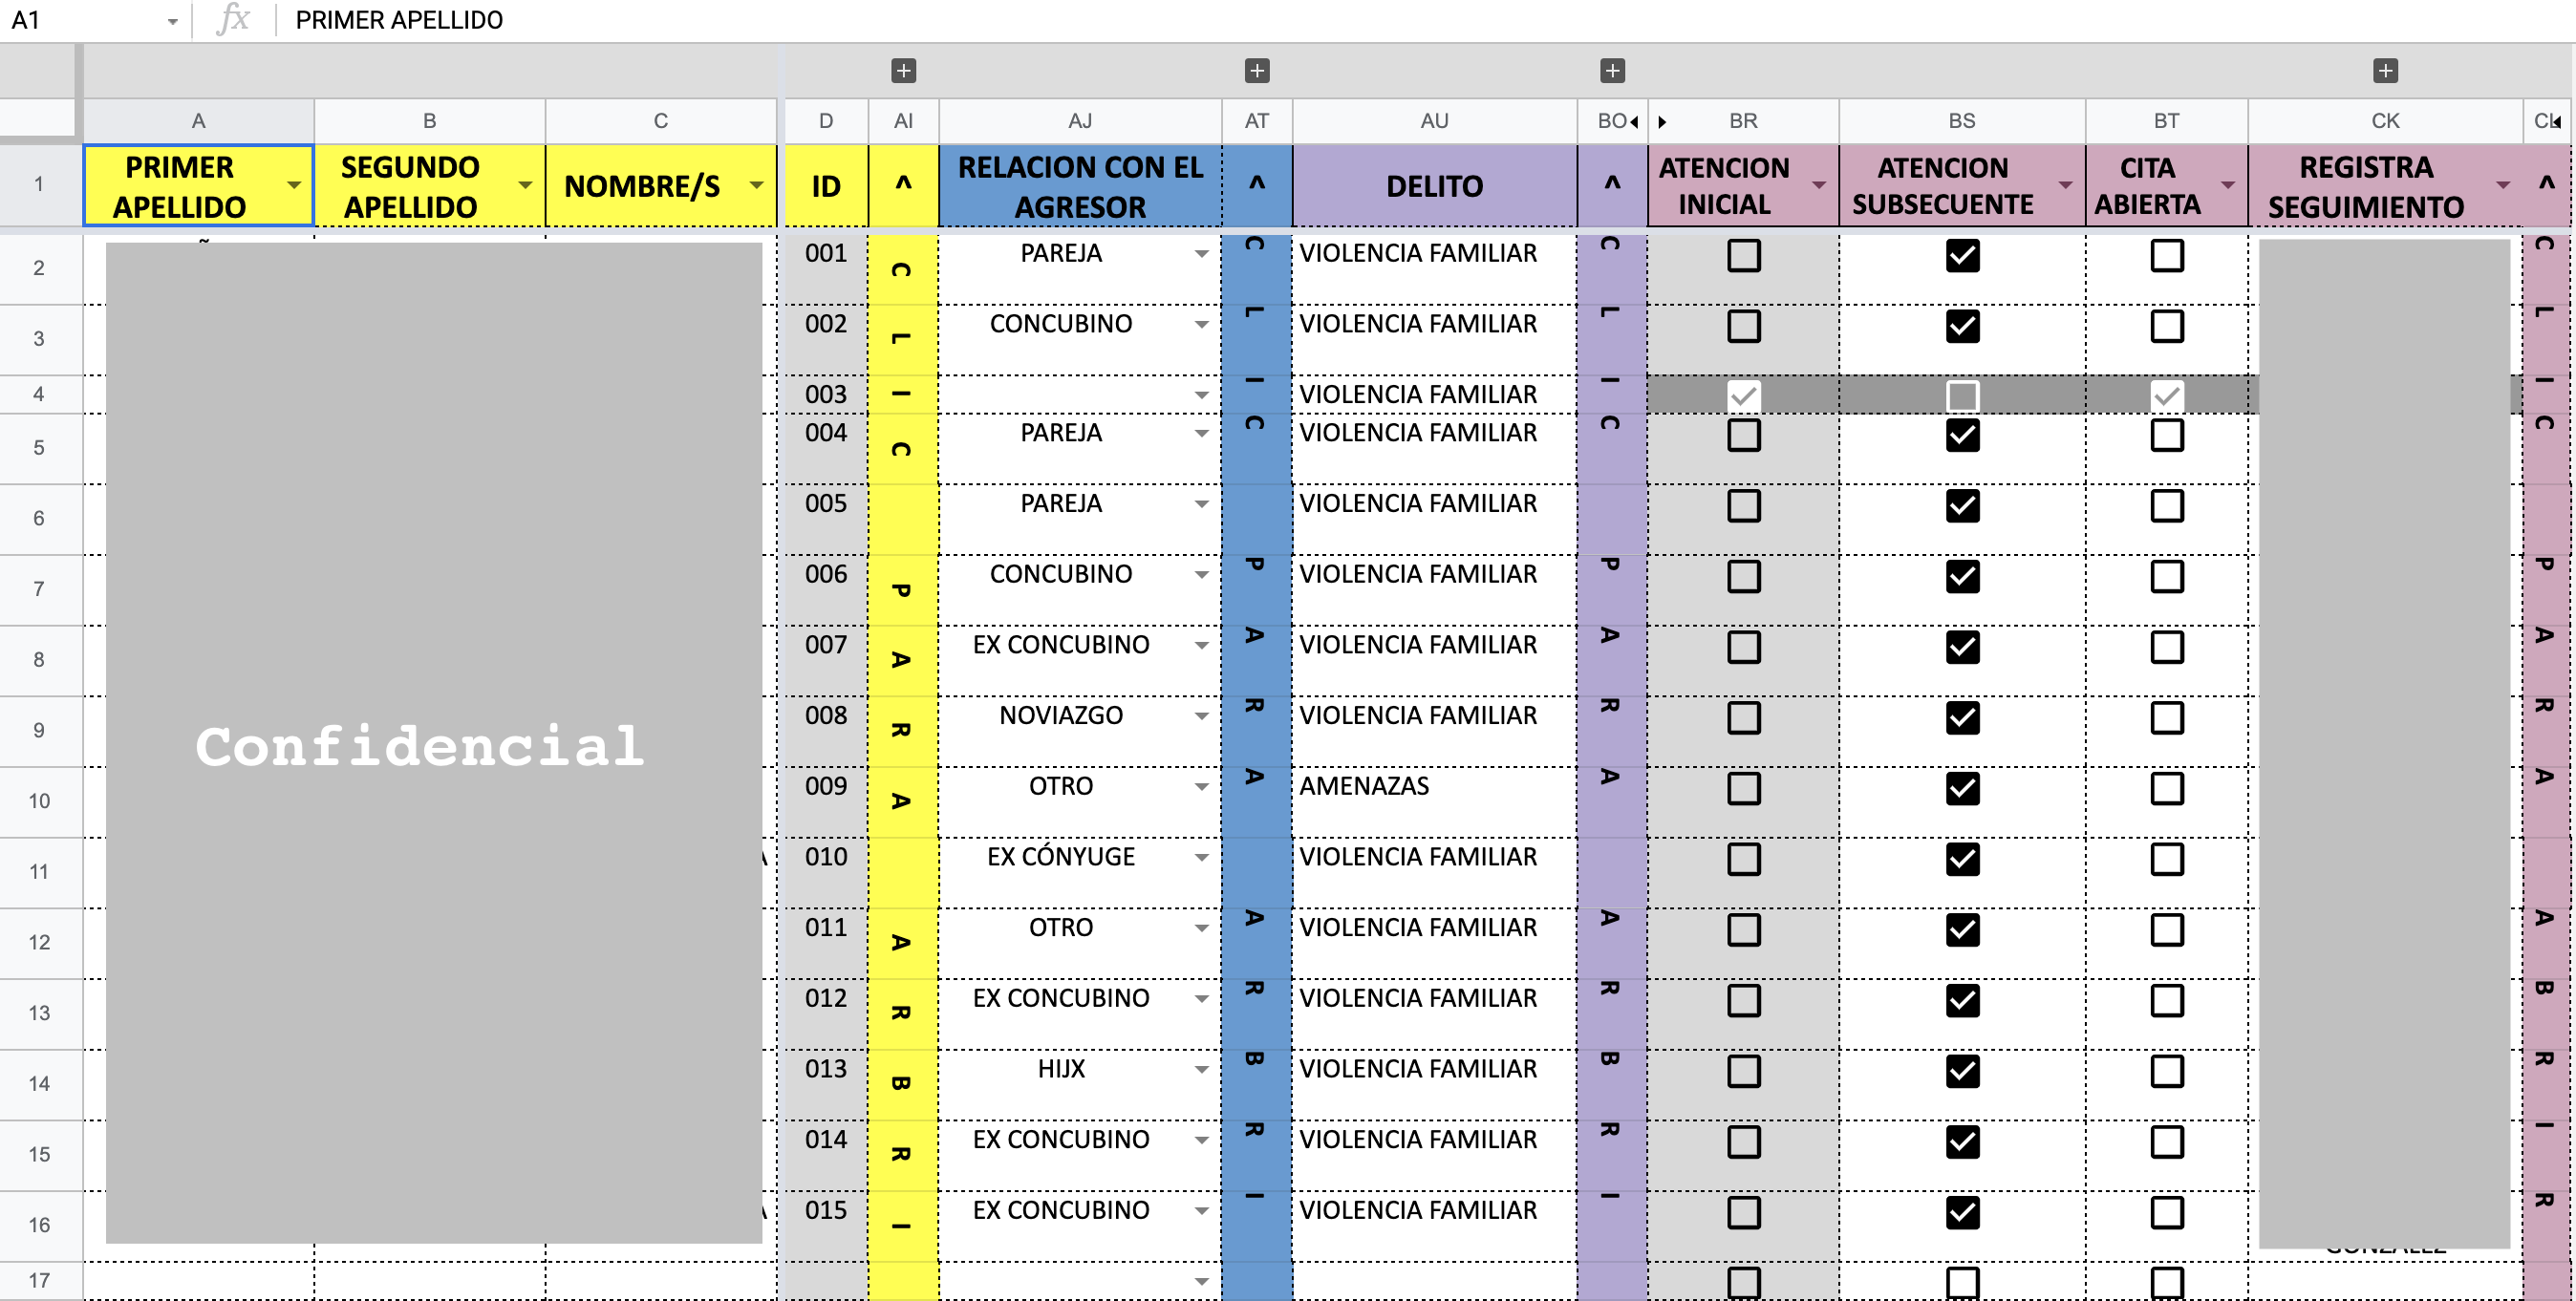
The follow-up panel is the tool in which the most important innovations were made concerning the tools previously used by the LUNAS. In the following image, you can see in detail the information that is collected, and, later, we present a summary of the innovations that it includes.
Innovations in the Tracking Tool
Spreadsheets in the cloud: The first innovation concerning the traditional way of working of the LUNAS was to migrate from the generation of independent files, of which copies were generated and then shared by e-mail, to the use of spreadsheets in the cloud, having everything now online. This paradigm shift is fundamental for the operation of the Dashboard, which will be discussed later.
Information sorted by compressible dashboards: The tools we took as a reference shared the same attribute of being organized as databases. All of them included variables without thematic order and were of great horizontal extension, which required a great effort to find the information when needed. To address this, we designed a tool that integrates the variables into the above-mentioned categories and, in turn, these into panels so that they could be compressed, allowing only a couple of variables to be displayed for a quick consultation. In its most compact form, it all fits on a single screen.
Pre-filling of information and drop-down lists: Another feature that we found in the previous tools and that we sought to modify in this tool was the absence of elements that would help the quick filling of information and its addition. For example, buttons to select between options and drop-down lists. These elements speed up the filling and prevent cells containing the same information from appearing different because the information is written in different words or with spelling errors.
This is even more relevant in the follow-up panel, where people have to record every week what happened with each user. For this reason, an extra effort was made to make the filling out as agile and intuitive as possible. Thanks to the six-week pilot where a small group of LUNAS tested the tool, we learned that it has the potential to cut the time people spend on this administrative activity by up to half. Considering that it is a process that people spend between 4 and 6 hours per week on, this is not trivial at all.
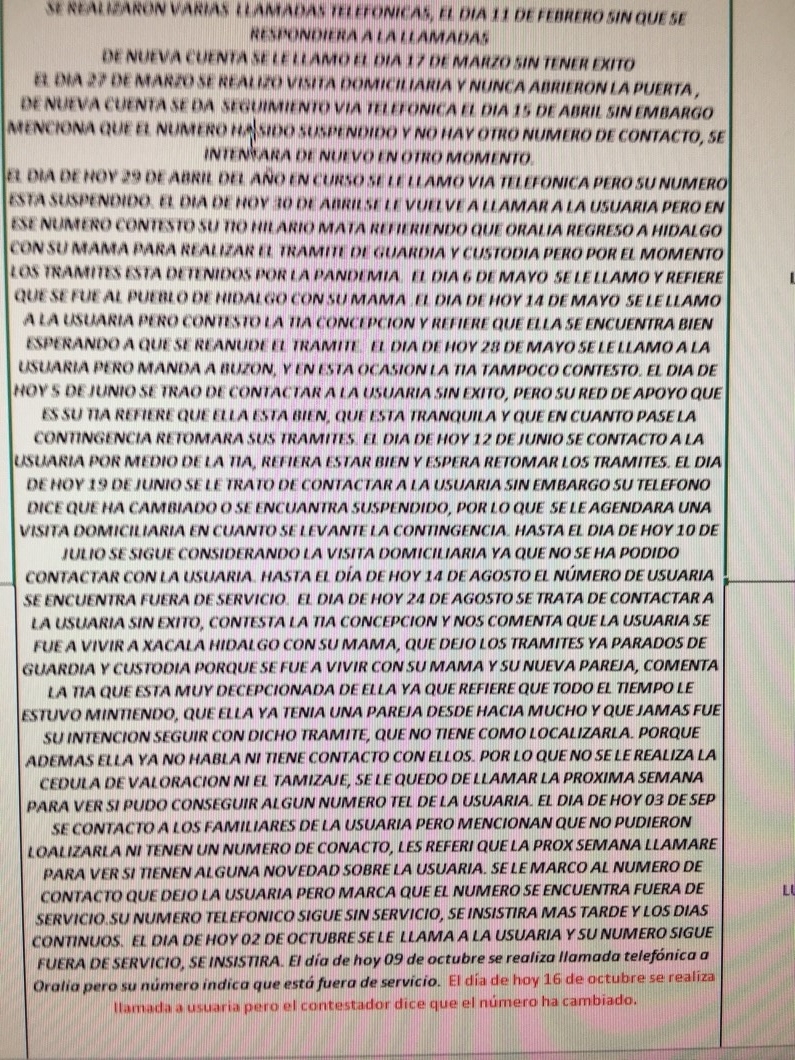
Auto-saving of information to create files: The major innovation in the tool is its ability to automatically save the contents of each user's weekly tracking panel. In doing so, the date on which the information was entered is integrated, making it possible to create an individualized record for each user. To understand this better, it is important to know the modus operandi of the tools previously used in the LUNAS.
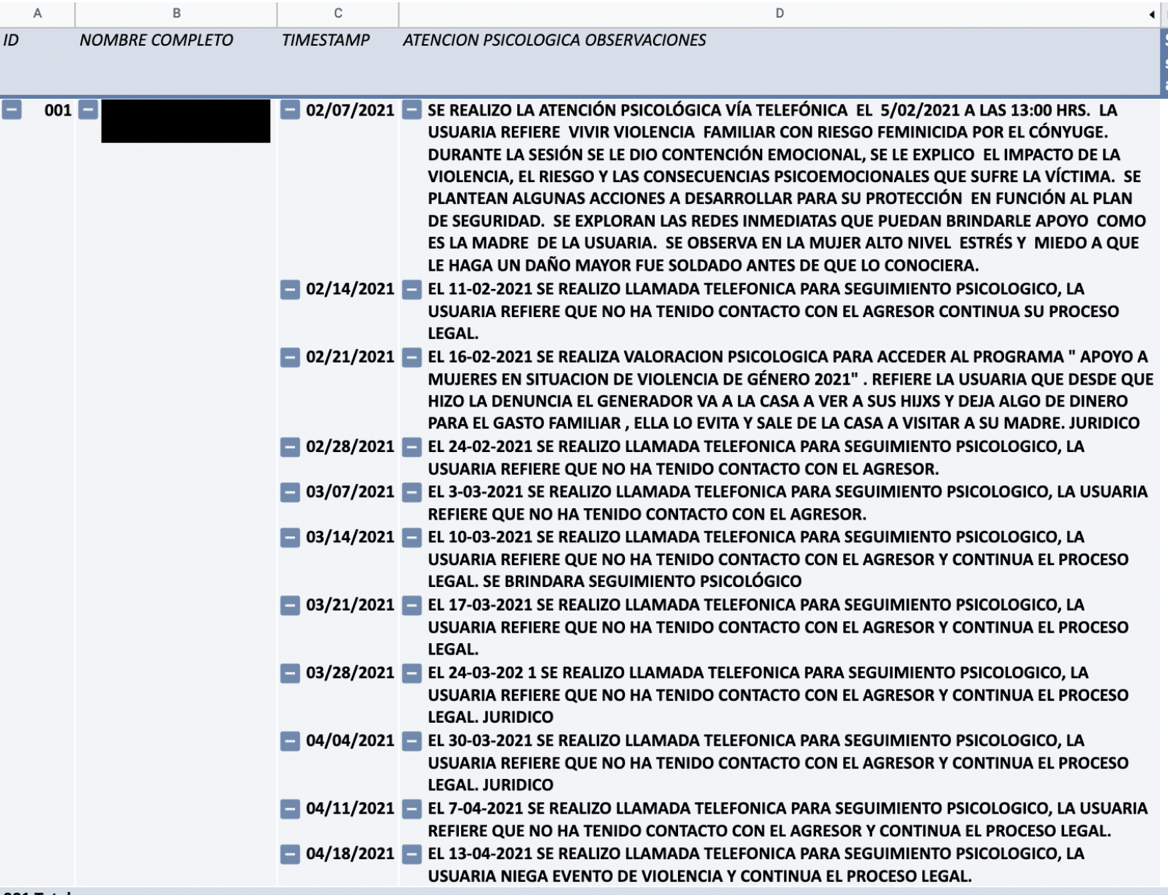
Previously, only one cell of the spreadsheet was used to integrate a user's record in the LUNAS, that is, in a single cell corresponding to the user’s row, information was added each week with the main events that had occurred. Although in terms of location is allowed to have all the information of a user easily, this was not an efficient way to sort the events by date or to calculate the time the user had been receiving public services. Below is an example of a user's record stored in a single EXCEL cell.
The new tool was designed to allow the LUNAS managers to perform the same task, but have the information sorted automatically and more efficiently. Thanks to a few lines of code in the spreadsheet script editor, the manager now enters the summary of what happened during the week, and this information is copied and sorted by date in a separate tab of the tool. The image below is an example of what a user's record looks like with the new tool. Now, the LUNAS managers can access the files and navigate through each user's record individually and do so in an agile way. It is also possible to compress the record and see only one of the users of interest, as well as to calculate the number of weeks the case has lasted.
Dashboard and its graphs and indicators
Finally, we will talk about the dashboard, which is fed from the database of each of the LUNAS and automatically and in real-time, keeps updated indicators and graphs with strategic information such as the number of women attended, risk levels, workload; and through which you can access the individual record of each woman receiving care. Each LUNA has its dashboard and there is also a general dashboard for central offices that aggregates information from all the LUNAS that use the tool. The dashboard was programmed using Microsoft's BowerBI business intelligence platform and contains the following visualizations.
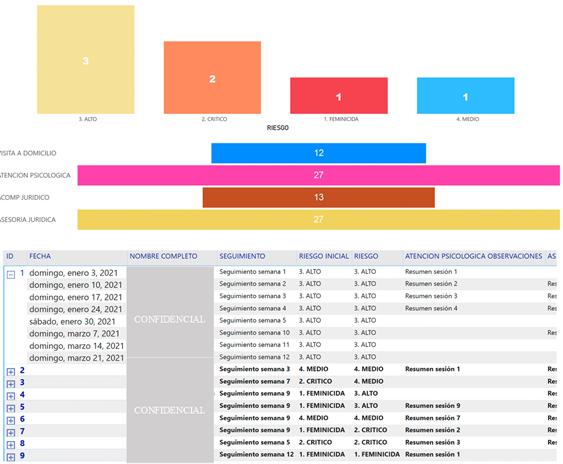
Number of users by risk level: When entering the Dashboard the first element that stands out is a summary of the number of users that a LUNA (or all LUNAS if we are talking about the General Dashboard) currently follows up on, classified by risk level. This provides a snapshot of the number of users' cases that are currently open since users receiving care do not necessarily attend the LUNA every week (although most do!).

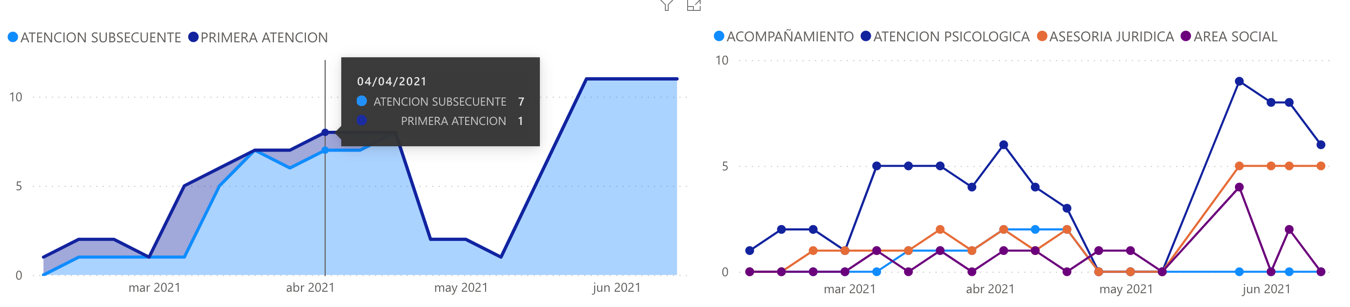
History of users visiting LUNAS and services provided per week: The second element contained in the Dashboard are two graphs. The first (left) shows the total number of user cases classified into two types: initial and subsequent care. A user is only considered for initial care during her first week of care, then she is considered for subsequent care. The same user could receive multiple services from LUNA: accompaniment, psychological care, legal advice, or social work services. The second graph (right) counts individually the services provided by the LUNA and shows their weekly trend. These two graphs allow monitoring of the trend of LUNA's workload in terms of the number of open cases and individual services provided.
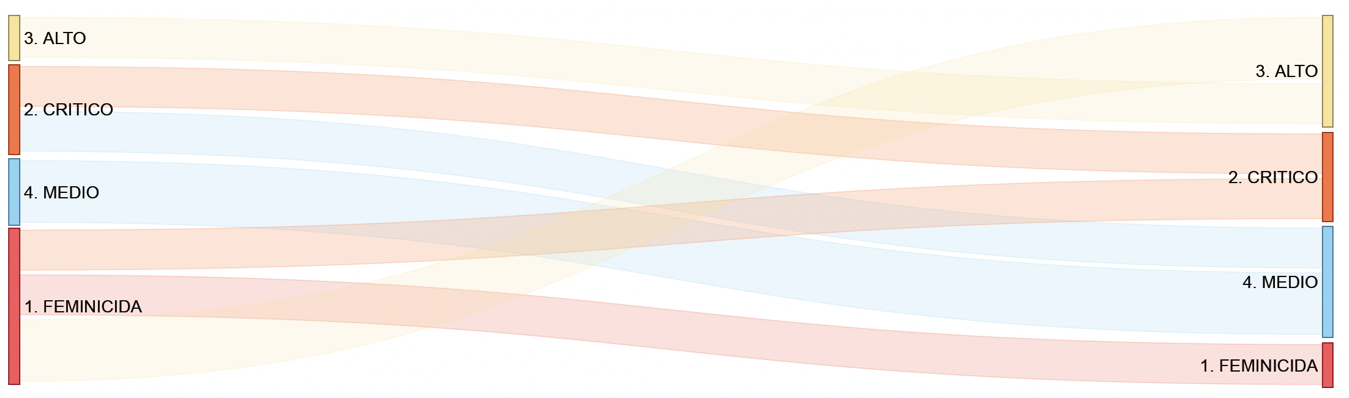
Changes in risk level: A third graph tracks changes in users' risk level relative to their initial risk (the one determined at the start of their case). This graph provides insight into the impact of the public services provided by the LUNAS. In their passage through Mexico City government services, the LUNAS centers assess the risk level of each user at the beginning and then monitor it regularly.
Access to individual records: Finally, the Dashboard contains a section where the individual record of each user can be accessed. For this purpose, two graphs were included, one with vertical bars (top) and the other with horizontal bars (center) to filter the files and make navigation easier. At the same time, the user records can be collapsed and expanded to make navigation easier.
Only five LUNAS in Mexico City participated in the usability pilot of this tool. This period served to refine the tool. Now, with the lessons learned, we are in the process of integrating everything into a user guide to facilitate adoption by the Mexico City Ministry of Women.
Do you have experience in digital transition processes of public offices and "Smart government"? Do you know the work done by the LUNAS in Mexico City or do you want to share with us ideas on how technology can be incorporated to improve the protocols for the care of women and girls at risk of violence? Write us, we want to hear from you!


