Pacific Regional Progress (excluding Australia and New Zealand)
Important stories live in our data and data visualisation is a powerful means to discover and understand these stories, and then to present them to others. Catrina Rowe writes on how data visualisation is being utilised to tell the Pacific SDG story at home and on the world stage.
By the numbers, the Pacific region presents a complex and diverse SDG context. 19 countries and territories. Two large metropolitan nations, Australia and New Zealand. 17 Pacific Island countries ranging in size from Papua New Guinea with 8 million people to the tiny micro-states of Niue, and Tokelau with just 1,500 people each. The scale of the Pacific is vast. These countries know themselves as the ‘large ocean island states’ or the Blue Pacific owing to the fact that 98% of the region is covered by ocean. Kiribati’s three atoll archipelagos, for instance, are spread over 3.5 million kilometres, roughly the same size as India.
With many of the MDGs left unfinished, and Pacific nations facing an existential threat due to the rapidly increasing impacts of climate change, development needs in the region are high, and need global attention.
The Pacific has made a good start. Many countries have localised the goals, and aligned their own national plans and strategies. At a regional level, countries have worked together to select 132 SDG indicators (the Pacific Sustainable Development Indicators) that best tell the regional development story in the Pacific and have committed to regular reporting against these in order to closely monitor progress and focus attention where it is most needed.
Tracking 132 indicators over 19 countries is extremely challenging for responsible institutions, and like many regions, the Pacific is still struggling to collect, organise and analyse headline-level data. Let alone produce time-series data to measure progress and change. As such, reporting on development progress in the Pacific tends to be narrative- based, and often dominated by anecdotal data and informed guesstimates. The SDGs targets and indicators framework present an opportunity to revolutionise reporting and legislative and policy formulation in the Pacific: adding rigour, discipline and creating a genuine record of progress over time.
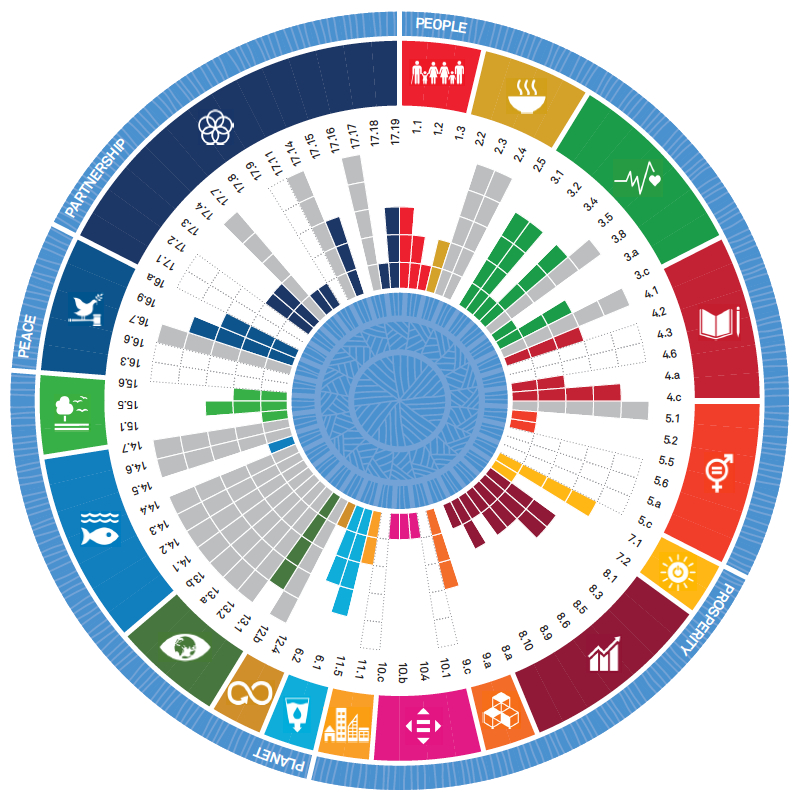
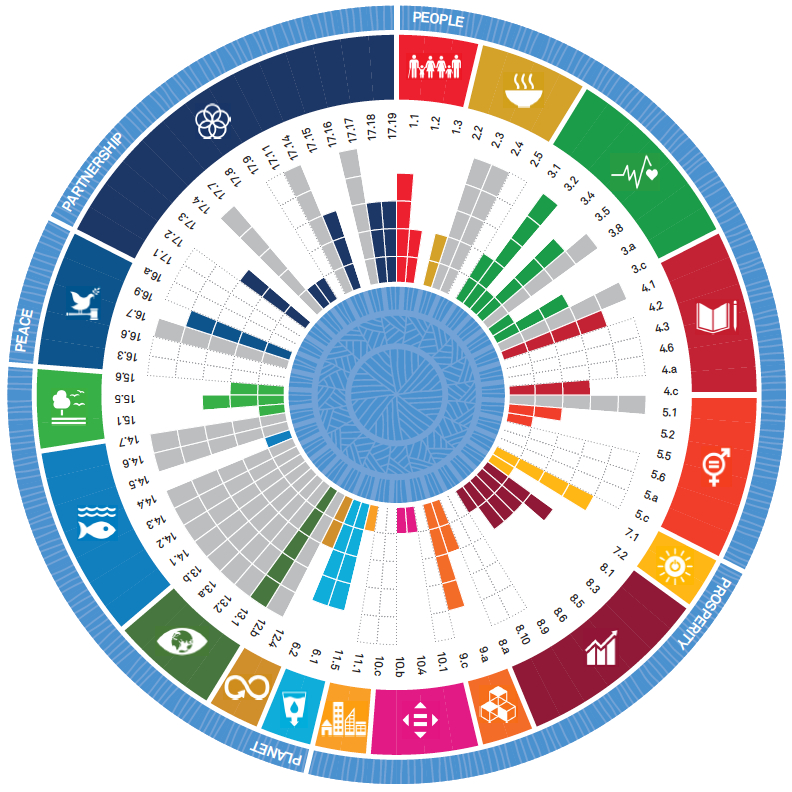
With all these factors in mind, the Pacific SDG Partnership within UNDP, has led a collaboration with the Pacific Islands Forum Secretariat (PIFS), and the Pacific Community (SPC) to create SDGs Progress Wheels for each Pacific Island country, and at the regional level as well.
The Progress Wheels utilise data visualisation methods to present a large array of SDG- related data on a single page. Data visualisation is the graphical display of abstract information for two purposes: sense-making and communication.
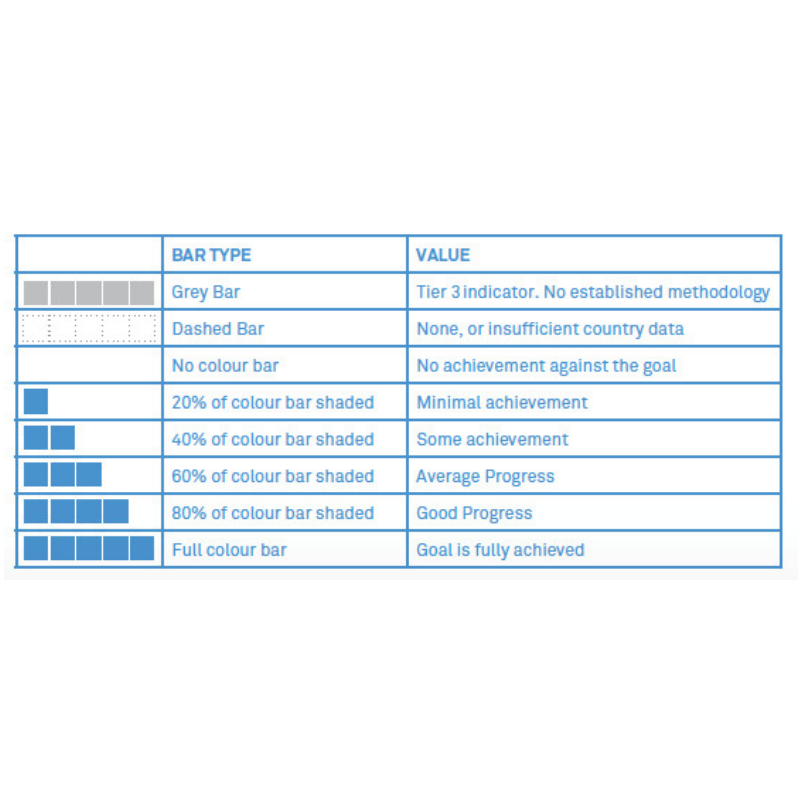
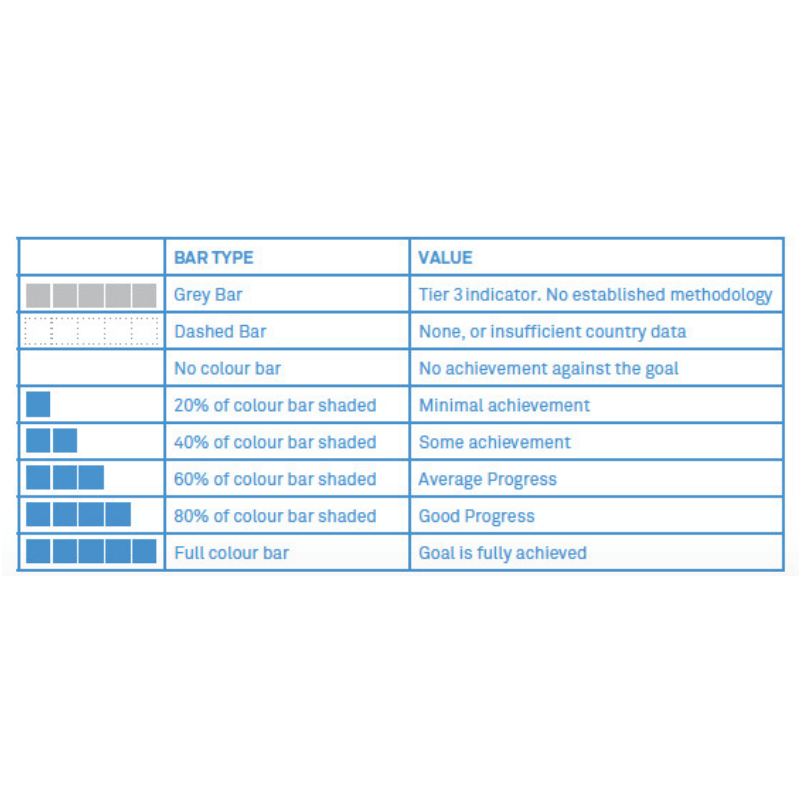
The Pacific SDGs Progress Wheels provide a snap-shot of country and regional progress and the current state of available data for each of the Pacific Sustainable Development Indicators. They are designed to help leaders and decision-makers identify the state of progress and data gaps in a clear and succinct format.
They form a companion resource to the first Pacific Sustainable Development Report and are intended to support countries with their own reporting and data analysis.
Perhaps the strongest message the Progress Wheels relay is related to the paucity of data. For the Pacific, at least, comprehensive data sets are so far unavailable, lacking agreed methodology, or insufficient. This issue is particularly acute in relation to the key areas of climate and oceans.
Tonga
It is hoped the SDG Progress Wheels can be an advocacy tool for the region, shining a light on the extent of the data challenge, and strengthening resource mobilisation to improve data collection, analysis and reporting in the Pacific.
The SDG Progress Wheels build off a model utilised in the MDGs, and one or two countries using a similar approach for national SDG reporting, notably Slovenia. This project represents the first time a data visualisation approach has been taken in a multi-country and/or regional context.
The Pacific SDG Partnership will coordinate annual production of the Progress Wheels, and is excited to explore and collaborate on other data visualization products, initiatives and tools. We would love to hear from you.
The methodology used to create the datasets applied in the progress wheels is included on page 3 of the full document here.

 Locations


