
 Locations
Poverty and carbon emissions on the rise
Growth without gains
October 16, 2023
Decoupling economic growth from carbon emissions is critical to reducing poverty while protecting the environment.
Photo: UNDP Mauritius


There is a disconcerting trend among many countries where economic growth has not effectively translated into poverty reduction, while perpetuating its detrimental effects on the environment. Despite experiencing economic growth post-2020, a third of 160 countries analysed witnessed a surge in extreme poverty. Sub-Saharan Africa is the most adversely affected region, with an average of 130,000 individuals per country moving into extreme poverty per percentage point of GDP growth each year. At the same time, the carbon intensity of GDP (tonnes of CO2 per US$1,000) is projected to have increased during 2021-2023 in a third of countries, which are thus failing to decouple emissions from growth.
We analysed aggregate post-pandemic trends in economic growth, poverty rates, and carbon emissions in 160 countries — encompassing around 96 percent of the global population — for which there’s comparable data. The crude, overall picture is that the development we want in terms of increased well-being of people and planet continues to be held hostage by the growth we get at all costs.
Out of 160 countries studied, 137 saw their economies grow consistently after the pandemic. In over half (60 percent) of these growing economies, the number of people in extreme poverty (i.e., living on less than $2.15 per day) slightly reduced as the economy got better from 2021 to 2023: on average, for every one percentage point increase in GDP, around 39,000 people per country were lifted out of extreme poverty each year. In contrast, in the other half of these growing economies, the opposite happened: every one percentage point increase in GDP corresponded to an average of 64,000 people per country falling into extreme poverty each year (Figure 1). This means in nearly half the countries experiencing economic growth, the number of extremely poor people was actually increasing.
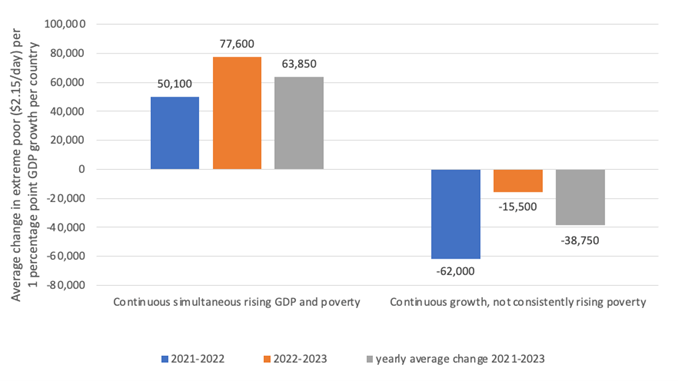
Figure 1. Average annual change in the number of people in extreme poverty ($2.15 a day) in countries experiencing continuously rising extreme poverty headcounts alongside consistent economic growth (51 countries, left panel) vs in countries with continuous economic growth without consistently rising extreme poverty (75 countries, right panel), 2021-2023.
Note: Eleven countries that experienced continuous economic growth have no recorded population living below the extreme poverty line in 2023 and are thus not considered in this figure. Source: Own elaboration based on binned distributions ($0.10-bins) of per capita income or consumption (2017 PPP) reconstructed from the World Bank’s Poverty and Inequality Platform through the pip: Stata Module (version 0.9.5), and GDP growth rates computed from the IMF, World Economic Outlook (WEO) Database (April 2023).
This trend of people falling into extreme poverty while the economy grows varies significantly depending on a country’s income level. In upper-middle-income countries (UMIC), every one percentage point increase in GDP corresponded to more than 113,000 people per country falling into extreme poverty each year on average. In low- and lower-middle-income countries (LICs and LMICs), this number is about 20 percent and 40 percent lower, respectively (Figure 2). Regional disparities are also evident. For example, in sub-Saharan Africa, nearly 130,000 people per country falling into extreme poverty on average accompanied every one percentage point increase in GDP each year. In contrast, this number is more than halved in Asia and the Pacific.
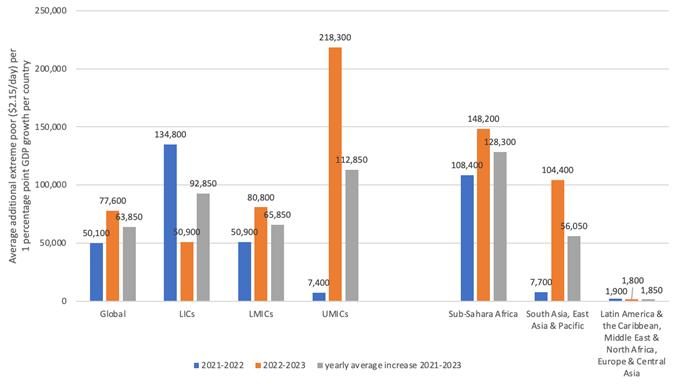
Figure 2. Average annual change in the number of people in extreme poverty ($2.15/day) in the 51 countries experiencing continuously rising extreme poverty headcounts alongside consistent economic growth 2021-2023, globally and by income group (left panel) and by region (right panel).
Notes: Of the 51 countries recording simultaneous increases in GDP and extreme poverty, 12 are LICs, 17 LMICs, 9 UMICs, and 13 HICs (not included as numbers are negligible by comparison). Twenty-three of those 51 countries are developing economies located in Sub-Saharan Africa, 5 in South/East Asia and the Pacific, 4 in Latin America and the Caribbean, 4 in the Middle East and North Africa, and 2 in Europe and Central Asia. The other 13 are advanced economies (again not included as numbers are negligible by comparison). Source: Own elaboration based on binned distributions ($0.10-bins) of per capita income or consumption (2017 PPP) reconstructed from the World Bank’s Poverty and Inequality Platform, and GDP growth rates computed from the IMF, World Economic Outlook (WEO) Database (April 2023).
When we look at the higher poverty line of $3.65 a day, the trend is less pronounced, though it’s still concerning: About 23 percent of countries, primarily the poorer ones (LICs and LMICs), saw the number of people living in poverty increase, even though their economies were growing.
This pattern of mainly extreme poverty ($2.15 a day) being on the rise suggests that the benefits of economic growth aren’t reaching the poorest people and countries. In other words, the gap between the rich and poor seems to be widening. Moreover, in most countries, the rates of poverty (as percentages of total population) remain stagnant: 51 out of 53 countries experiencing growth are showing no improvement at the $2.15-a-day poverty line and 22 out of 25 countries at the $3.65-a-day threshold. This underscores a crucial issue (and an old empirical debate): economic growth by itself may not effectively reduce poverty.
At a critical point in the race against global warming, another alarming trend is the growing amount of carbon emissions for every dollar of economic growth. While advanced economies are making some progress in reducing emissions as their economies grow (relative decoupling), this is not the case for the majority of developing countries: in 80 percent of the poorest countries, 66 percent of LMICs, and 18 percent of UMICs that are growing, fossil carbon emissions are increasing as their economies expand. The problem is particularly acute in Asia and the Pacific, where, for every one percentage point increase in GDP, an additional 19 kg of CO2 is emitted per $1 (2017 PPP) each year (Figure 3). As this path persists, the world is heading towards a dangerous imbalance where our pursuit of economic growth (the growth we get) comes at a significant cost to the environment, jeopardizing the well-being and future of our planet and the lives of generations to come.
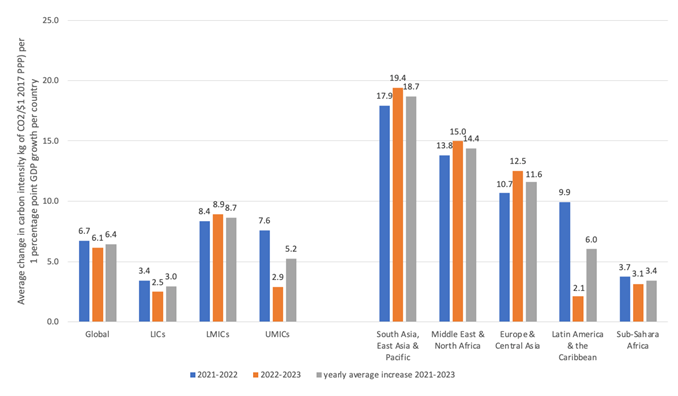
Figure 3. Average rising carbon intensity (kg of fossil CO2 emissions per $1, 2017 PPP) per one percentage point GDP growth in the 52 countries experiencing continuously rising carbon intensity alongside consistent economic growth 2021-2023, globally and by income group (left panel) and by region (right panel).
Notes: Of the 52 countries recording simultaneous increases in GDP and carbon intensity, 16 are LICs, 29 LMICs, and 7 UMICs. Thirty-two countries are located in Sub-Saharan Africa, 9 in East/South Asia and the Pacific, 5 in the Middle East and North Africa, 4 in Latin America and the Caribbean, and 2 in Europe and Central Asia. Source: Own elaboration based on data from the Global Carbon Budget 2022 and EDGAR 2023 (JRC and IEA), and the IMF, World Economic Outlook (WEO) Database (April 2023).
The early development doctrine after World War II conceived economic growth at all costs as the key to improving people’s incomes and living conditions. This notion has dominated the global development agenda since then, positioning economic growth as the ultimate yardstick of progress. UNDP’s recent Integrated SDG Insights Reports revealed that also today, most governments consider job creation and economic growth the main drivers to achieve the SDGs. However, the recent trajectories of socioeconomic progress, rather fragile in the face of severe, intertwined crises and environmental decay underscore the need for a more nuanced approach to sustainable development. Today’s challenges demand a rethinking of our approach to development. Economic growth, while essential, is not a silver bullet—at least not the traditional growth we know. To build a truly sustainable and fair world, as envisioned by the SDGs, our approach must be multifaceted, integrating economic, social protection, and environmental policies effectively.
Methodological endnote
The projected poverty headcounts for the period under analysis are based on binned distributions ($0.10-bins) of per capita income or consumption (2017 PPP) in 2019 reconstructed from the World Bank’s Poverty and Inequality Platform through the pip: Stata Module (version 0.9.5); GDP growth rates computed from the IMF, World Economic Outlook (WEO) Database (April 2023); and population growth rates computed from the United Nations, World Population Prospects 2022. First, we project forward the distribution to 2020 by applying the country’s GDP per capita growth rate between 2019 and 2020 (WEO April 2023) to each country’s bin, with a pass-through rate of 85%. Fifty-two countries collected household surveys in 2020 and had an actual survey in 2019. Based on these, the incidence of growth by quintile (2019-2020) in these countries is extrapolated to the remaining countries (depending on the region), and hence, the global distribution in 2020 accounts for the distributional change induced by the pandemic. The poverty estimates for 2021-2023 are then computed by projecting forward the distribution of income or consumption in 2020 using the WEO forecasts of April 2023 for GDP per capita. From 2020, the projection is distribution-neutral with a pass-through rate of 85%. For the indicator on carbon emissions, the computations are based on GDP data from the IMF World Economic Outlook (WEO) Database (April 2023), and on fossil CO2 emissions by country in 2021 from Friedlingstein et al. (2022). “Global Carbon Budget 2022.” Earth System Science Data, 14: 4811-4900, and EDGAR 2023 (JRC and IEA). The projection of fossil CO2 emissions for the period 2022-2023 is based on the countries’ average annual growth rate of emissions during the decade 2009-2019.
Related
content
content


